5. Evaluating Gender and Geographic Trends in Voter Registration
During this tutorial, you’ll practice basic data analysis with voter registration information. We’d like you to improve your ability to:
- utilize basic operators in Microsoft Excel (including calculating sums, differences and percentages)
- employ the SUMIF function in Excel, and
- explore political considerations of the data you have analyzed.
Why Voter Registration Data?
As we mention in the Election Data Guide, a fair voter registration process fosters political equality and actively encourages the inclusion of eligible voters. When the voter registration process is fair and transparent, it can increase the legitimacy of an election. Alternatively, when the voter registration process is poorly executed or does not provide for equal participation, it can cast doubts on the legitimacy of an entire election.
Civil society organizations often use voter registration statistics to determine whether the overall process was fair and inclusive. Modules 5 and 6 will improve your ability to undertake this important kind of analysis.
Welcome back to Opendya!
For this exercise, we’re heading back to Opendya. You were able to get ahold of a set of voter registration data compiled by the Election Commission, which includes the number of registered voters by district. Before diving into the data, here’s some additional political background you should be familiar with:
- Opendya had national elections in 2010 and 2014.
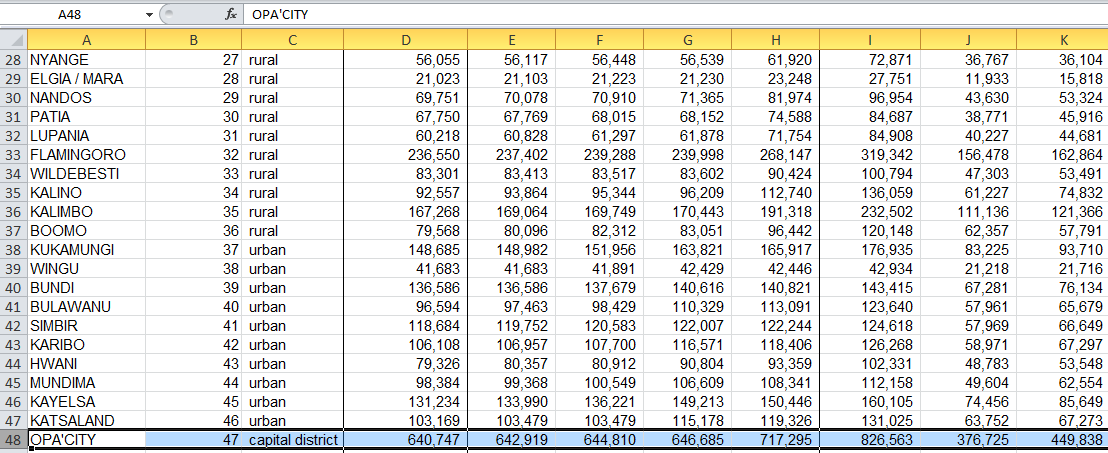
- The capital of Opendya is in the Opa City district (District code: 47), which contains a mixture of urban and rural areas.
- Since the 2010 elections, violent conflict broke out in two districts: Conflicteri (District code: 9) and Disputana (District Code: 23).
- Ahead of the 2014 polls, the Election Commission of Opendya conducted a five-week voter registration update exercise, adding new voters to the rolls.
You’ve got the background, now let’s check out the data. Download Opendya’s voter registration data here. You’ll need this file to complete the exercise.
Reviewing the Voter Registration Data
We’ll get familiar with Opendya’s voter registration data by reviewing the contents of each column of the file you just downloaded. For now, we’re just going to review the Registration_Data tab in your file. (Ignore the Data_Summary tab until the second half of this module.)
District_Name
The far left column contains the names of all districts in Opendya. Notice that this is the only geographic level provided in the dataset. At this stage, we have no further indication as to whether these districts are nearby one another or if they fall under the same geographic units at a higher level.
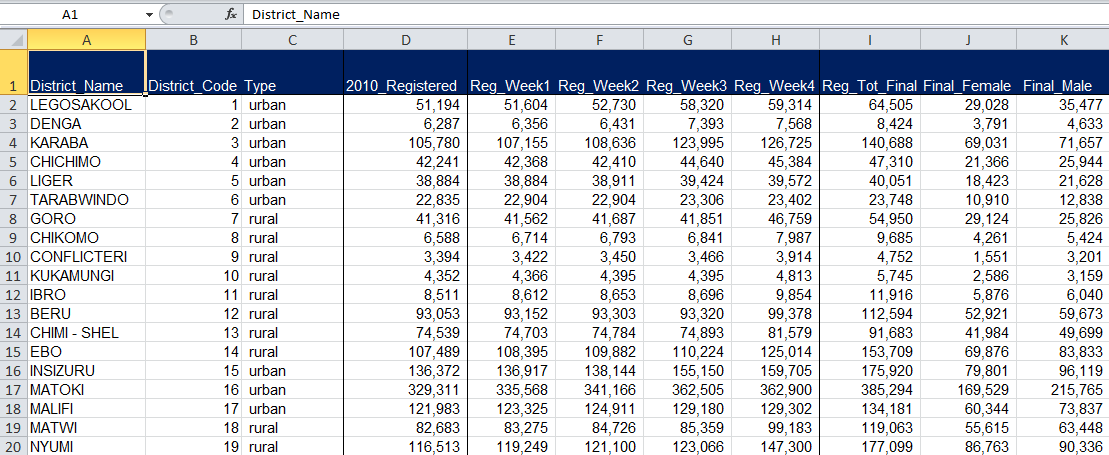
Scroll to the bottom of the data to see how many districts are in Opendya.
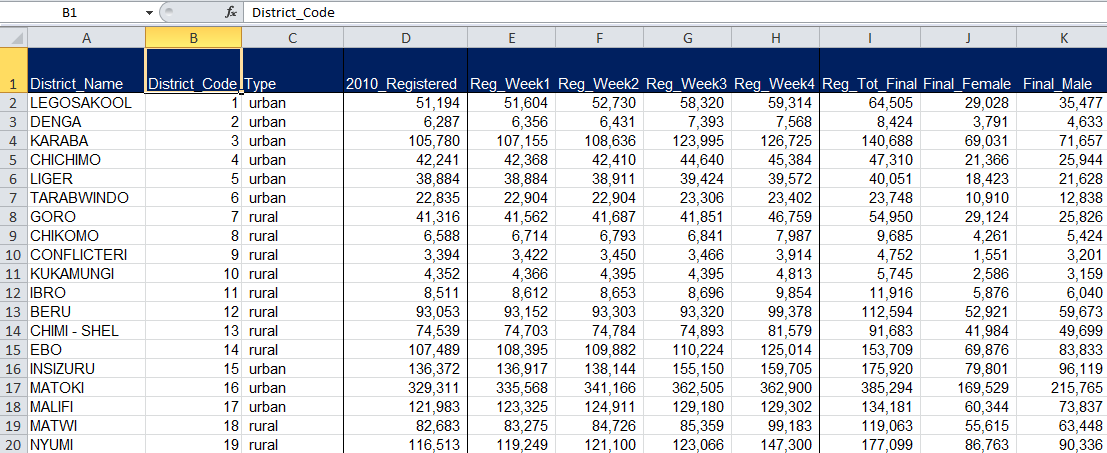
District_Code
The Election Commission of Opendya also assigns each district a unique code, or identifier. Take a quick second to scroll through the file and notice the pattern of how the districts are numbered. (This is an easy one!)
As we mentioned in Module 2: Reviewing a Polling Station List, unique identifiers are extremely helpful when dealing with datasets. They help us catch duplicate entries and/or properly distinguish between units with similar names.
Type
The Type column indicates the characteristics of Opendya’s districts. Check through the data to review what descriptors are used to indicate the type of district. What different types do you see?
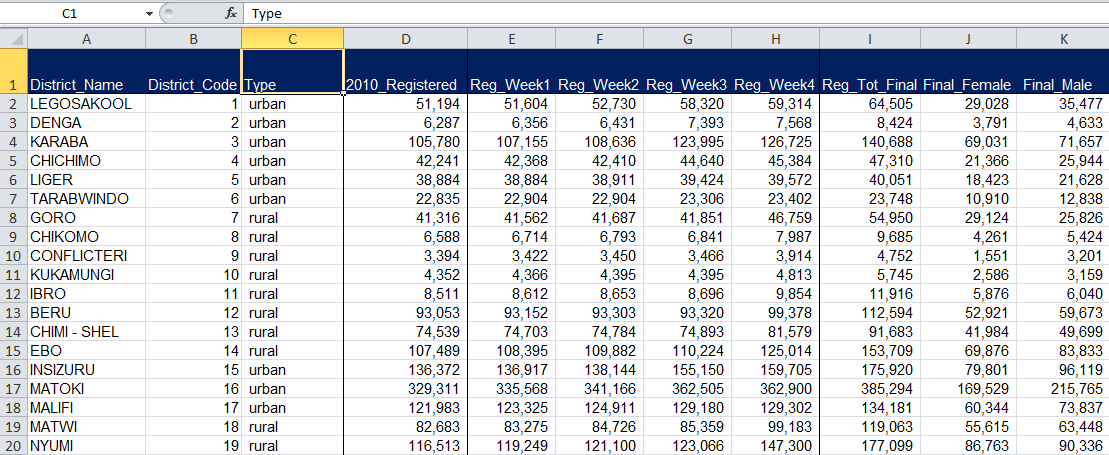
There are three types of districts in this dataset: urban, rural, and capital district.
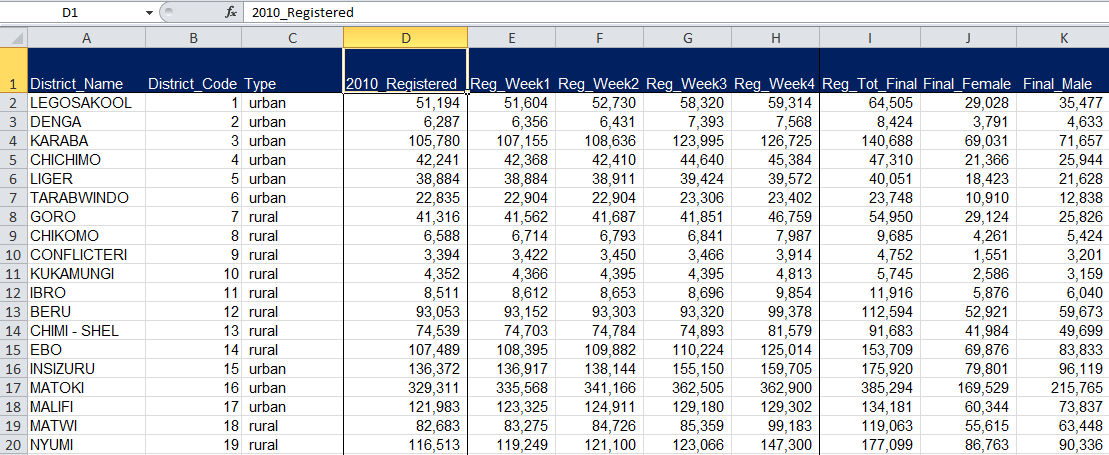
2010_Registered
We mentioned previously that Opendya had national elections in 2010. This data set contains the final number of registered voters when that election took place. We can use the 2010_Registered column to compare registration figures between election cycles.
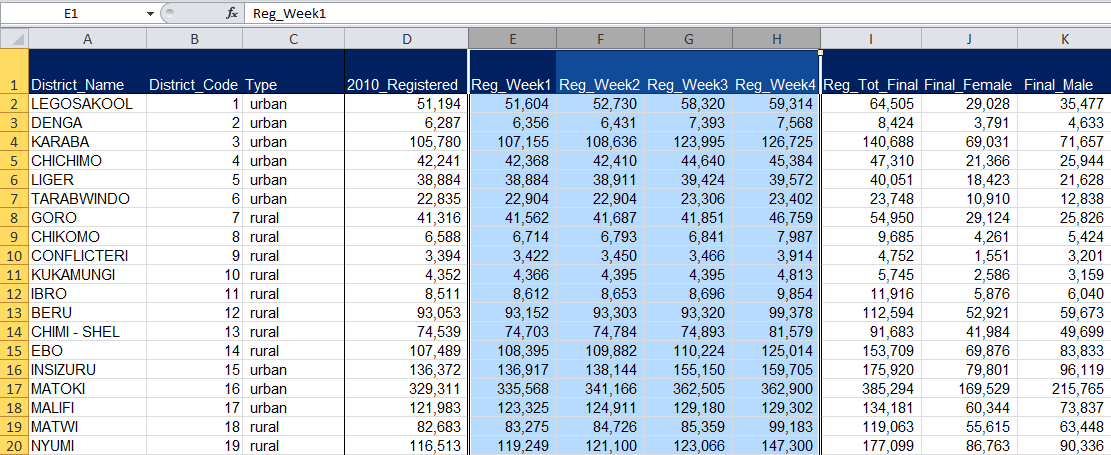
Reg_Week1, Reg_Week2, Reg_Week3, and Reg_Week4
We mentioned that Opendya’s Electoral Commission undertook a five-week voter registration update in 2014. The following four columns – Reg_Week1, Reg_Week2, Reg_Week3, and Reg_Week4 – provide us with the total number of registered voters at the end of four of the five weeks of the 2014 update exercise. The difference between each week gives us the number of new voters who registered during the exercise.
These numbers can tell us how the the Electoral Commission performed over time and can highlight any spikes or lulls in registration in specific districts and/or at specific moments. You’ll work with these columns to complete Module 6, but won’t need them much in Module 5.
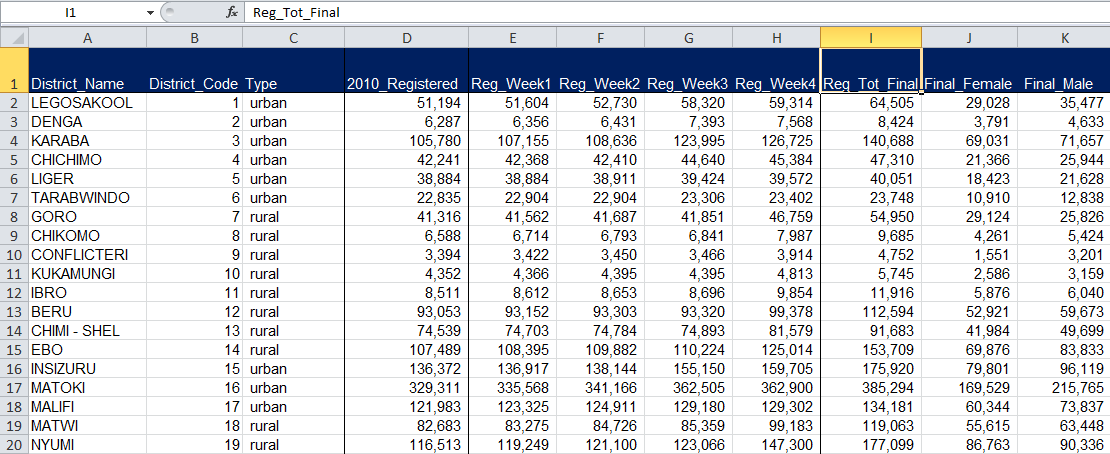
Reg_Tot_Final
The Reg_Tot_Final column provides the final total of registered voters per district following the entire five-week registration exercise in 2014. Notice that the difference between figures in Reg_Week4 and Reg_Tot_Final accounts for voters who registered during the fifth and final week of the update period.
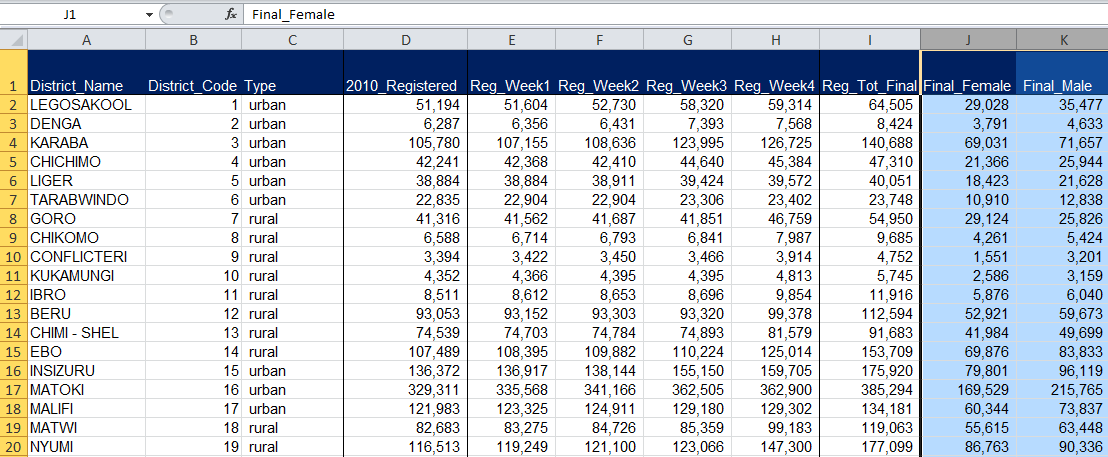
Final_Female, Final_Male
Here we can see how many women and men, in total, are registered to vote in each district for the 2014 election. Note that we only have the final 2014 figures of female and male voters, rather than weekly figures.
Now that we know our data, let’s move on to analysis.
Analyzing the Registration Data by District
There’s a lot of interesting analysis you can do with this voter registration dataset. Considering the data types you have available, what are three possible calculations you could make to illustrate trends in Opendya’s voter registration process?
See possible responses and begin your own voter registration calculations on the following page!
A. Comparing registration figures between 2010 and 2014
Let’s get a sense of how many new voters were added to Opendya’s registry between the 2010 and 2014 elections. To do so, we’ll need to complete two different calculations.
Calculating the difference between registered voters in 2010 and 2014
As a first step, we want to see how many more voters were registered per district in 2014 as compared to 2010. That will require a simple subtraction calculation in Excel, which will provide us with the difference in registered voters between Opendya’s election cycles.
We’ve pre-labeled your columns to be used for calculations in the Registration_Data tab. We’ll start by using column L, “Caclulated_nRV_incr_from_2010.” We’re not yet working with percentages; we simply want to know how many more individuals are registered per district. Before you begin, what columns do you think we need to work with to make this calculation?
Now let’s get started!
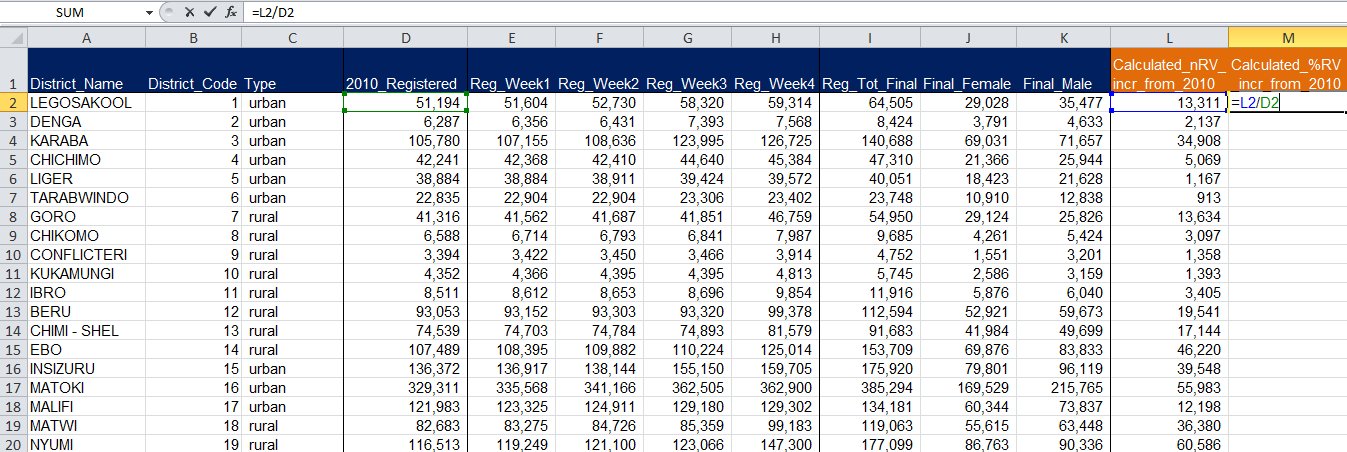
1. We need to subtract column D “2010_Registered” from column J “Reg_Tot_Final.” To do so, type an equals sign [=] into cell L2. This will tell Excel that you are typing in a formula. Then click on cell I2 (total registered voters in Legosakool). You’ll notice that Excel automatically adds the term “I2” to your formula (listed in the formula bar) once you click on that cell. Here, you are linking the calculation in cell L2 with the contents of cell I2. Alternatively, you could simply type in the term “I2” and Excel will automatically link to that cell.
2. Type a minus sign [-] which tells Excel that you would like to subtract an amount from cell L2.
3. Last, click on cell D2 (the number of registered voters in Legosakool as of 2010).
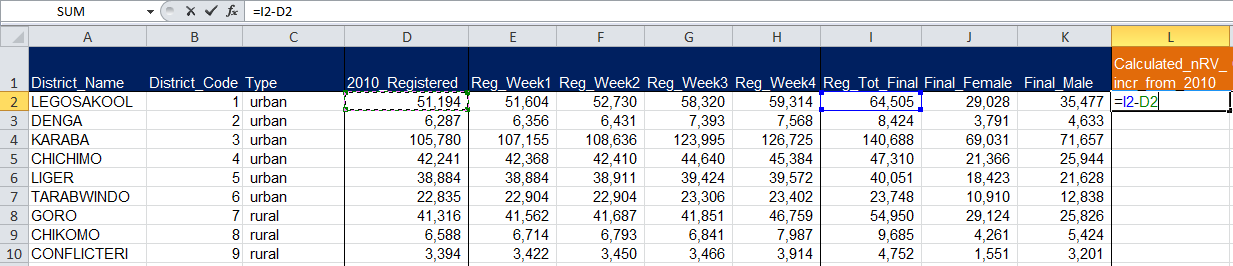
4. Hit enter and your calculation should appear! In Legosakool (the district you just calculated), what is the difference between the number of registered voters in 2010 and 2014?
5. Now you want Excel to make the same registration rate calculation for each of Opendya’s remaining 46 districts. Luckily, you don’t need to type in your formula 46 more times! Hover your mouse over the bottom right corner of cell L2; it should have a small square pictured. Note that your mouse will slightly change shape when hovering over the correct spot.
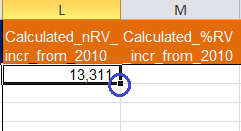
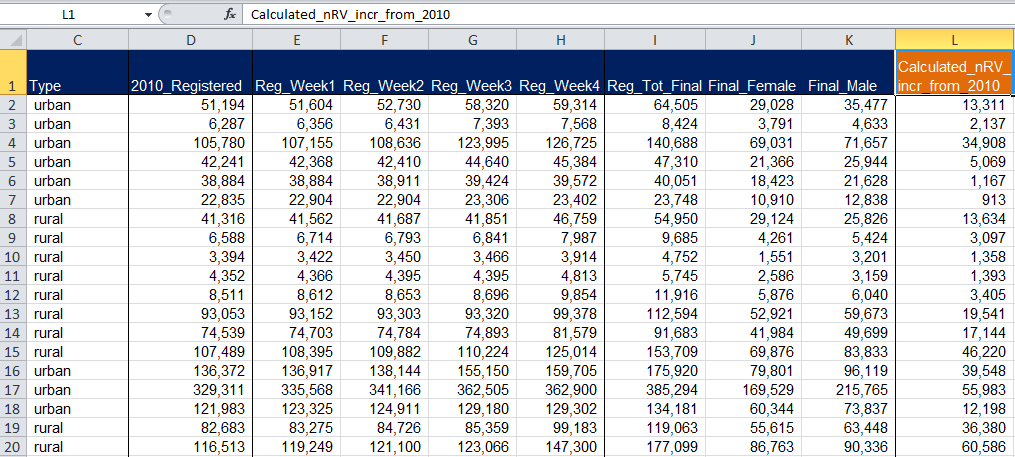
Double click the square in the bottom-right corner of cell L2 and voila! All of column L should auto-populate with the same calculation you typed into column L2. However, Excel is smart and knows that you want the calculation to pull data from a different row each time. For example, if you click on cell L8 (Goro District) you’ll notice that the formula bar reads “=I8-D8.” These calculations possess the same structure as your original subtraction formula, but now uniquely correspond to each of the different districts in Opendya. Click on a few different rows in column L to make sure Excel did what you wanted.
You now know the difference in registered voters between 2010 and 2014 for all 47 districts of Opendya!
Calculating the percent increase in registration between 2010 and 2014
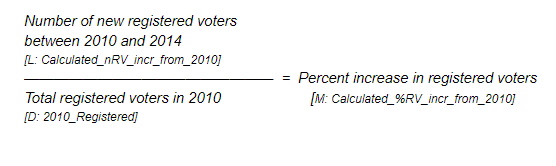
We now have figures for how the number of voters has increased in Opendya’s districts between 2010 and 2014. However, we need to calculate some percentages in order to give those numbers more meaning. Knowing each district’s “percent increase” in registered voters between 2014 and 2010 will give us a truer picture of how districts expanded their portion of registered voters, taking into account their respective sizes.
You’ll again need to use your knowledge of basic operators in Excel to make this calculation. Think back to the last calculation you made. We’ll use column M for this next calculation, labeled “Calculated_%RV_incr_from_2010.” Let’s think about the calculation we need to make. To calculate the percent increase in registered voters between 2010 and 2014, which columns in the dataset do you think we’ll need to use?
For this calculation, we need to use column L “Calculated_nRV_incr_from_2010,” which you just calculated, and column D “2010_Registered.”
1. Now let’s type our formula in cell M2. As with your last calculation, you’ll begin by typing an equals sign [=] (which will precede ALL of your future Excel calculations).
2. Then click on cell M2 (difference between 2010 and 2014 registered voters in Legosakool).
3. Type a forward slash, [/], which indicates division. You just told Excel that you want to divide the contents of cell M2 by something else.
4. Click on cell D2 (2010 registered voters in Legosakool). Hit Enter to show your percent increase calculation.
5. Remember how to ask Excel to replicate your calculation across all rows? If so, go for it! If not, click here!
Double click the bottom right corner of cell M2!
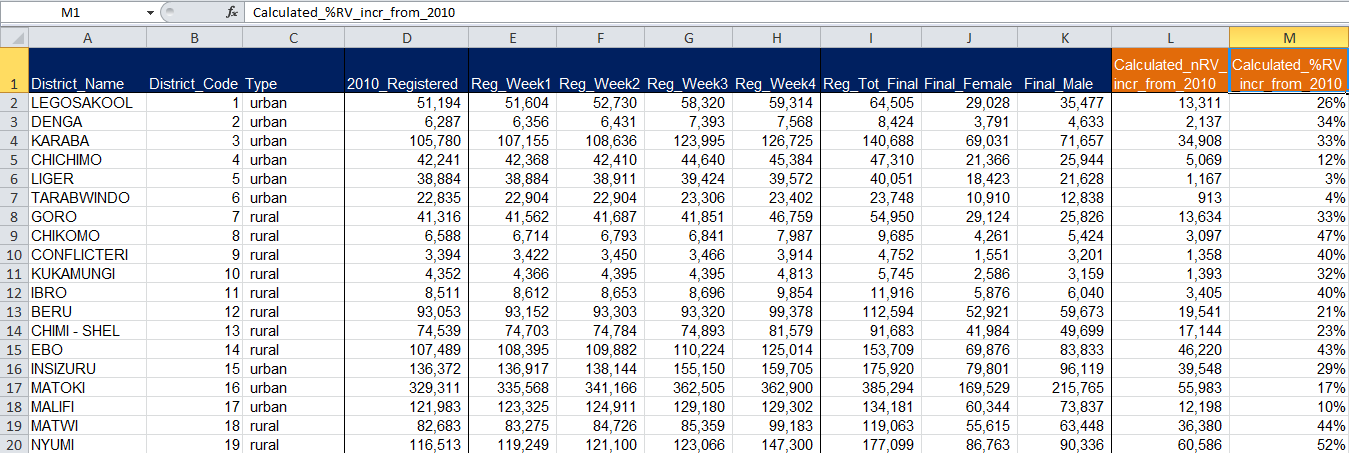
The above image is what your data should look like. However, if your entire column populated as “0s and 1s”, it means that your column is formatted as a “number” without any decimal points. To view your calculation, you’ll either need to add decimal points or reformat the cells of Column O as percentages.
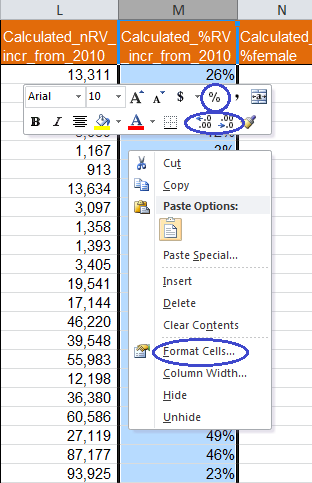
To reformat your cells, click the top of column O to select the entire column. Right click and select the “%” symbol. Alternatively, right click, select “Format Cells,” and then select “Percentage” from the left-hand menu of the pop-up box.
What do you see?
Now that we’ve calculated the percentage increase in registered voters between 2010 and 2014, take a moment to scan through the data.
1. What three districts have the lowest percent increase in registration rates? What types of districts are those?
2. What three districts have the highest percent increase in registration rates? What types of districts are those?
B. Checking for Gender Equality in Registration
A credibly organized voter registration process includes active participation and enrollment by both male and female voters. A careful analysis of voter registration data should thus include an investigation into the gender composition of the population of registered voters (when that data is made available – which it should be!).
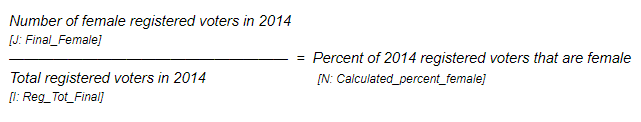
To get a better sense of the gender breakdown, let’s calculate what percentage of 2014 registered voters is women and what percentage is men. We’ll again use basic division in Excel.
Calculating percentage of female voters
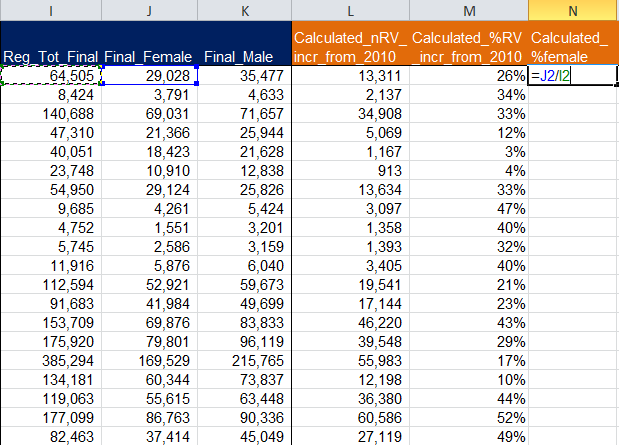
1. Column N will house our calculations on the percentage of female voters in each of Opendya’s 47 districts. Let’s call it “Calculated_%female.”
2. Take a moment to determine which columns you’ll need to divide to make this calculation. Keep in mind we’re interested in examining female voters after the 2014 exercise.
If you guessed column J “Final_Female” and column I “Reg_Tot_Final,” you would be correct!
3. Time to type in our trusty division formula! On your own in Excel, calculate the percentage of registered voters that are female in cell N2 (Legosakool District). Click here if you would like to view a screenshot of what your command should look like.
*Don’t forget to hit enter after you’ve typed this calculation.
4. After you’ve calculated the percent of female voters in Legosakool, have Excel replicate your calculation across the remaining 46 districts of Opendya.
Calculating percentage of male voters
Now for the percentage of male voters. Create a new column and use Column K “Final_Male” and the steps above as a guide to calculate the percentage of 2014 registered voters that are male in each district.
What do you see?
Scroll down to take a look at your two new columns of data.
1. How would you compare male and female registration rates at a glance?
2. Do any districts pop out at you for having especially high or low percentages of men or women voters?
3. Given what you know about Opendya, what might explain those trends?
Analyzing the Registration Data by District Type
C. Evaluating Overall Registration Trends Across District Type
Remember column C “Type” in the Registration_Data tab of our dataset? That column indicates whether a district is urban, rural, or the capital district. We’ll use column C to check for any patterns or differences in how Opendya’s voters from different types of districts were able to register. This type of analysis can reveal socio-political trends that might impact the credibility of an election process.
In sum, we’ll do the following types of analysis:
- Calculate basic registration figures (sums and percentages) for urban districts, rural districts, and the capital district.
- Analyze patterns in registration and consider their political ramifications.
Reviewing the Data_Summary Tab
For this portion of the module, we’re going to start using the Data_Summary tab in your Excel file. This tab will pull a summary of calculations based on data from the Registration_Data tab. It looks like this:

You’ll use columns A through E to complete Module 5 and columns F through O for Module 6. To speed things up, we’ve again pre-populated all of your column headers for you, which will house all of the different calculations you’ll need to do. Don’t be intimidated, this will be a breeze!
Using SUMIF to add up data in a specific category
For the remainder of this module, we’ll start to use an Excel function called SUMIF. The SUMIF function is used to add up values in a specific range of cells that meet a criteria you’re looking for. For our purposes, we’ll use SUMIF to add up registered voter figures that pertain specifically to urban districts, rural districts, and the capital district. Your new skills with SUMIF will build upon what your learned using COUNTIF formulas in Module 4: Detecting Bias in Ballot Qualification.
Here’s how the formula is structured: SUMIF(range, criteria, [sum_range])
- Range: Range specifies the area of cells that you want evaluated by your specific criteria. For our purposes, we are summing data based on the type of district. Since the “type of district” is our criteria, what column in your datasheet do you think we need to use for our range? What column do we look at for information on the type of district? (Answer = Column C, Type)
- Criteria: Your criteria will indicate whether or not a number should be summed. Criteria can come in the form of a number, expression, a cell reference, text, or a function that defines which cells will be added. For this exercise, you’ll be selecting from three different criteria [urban, rural, and capital district] and asking Excel to add voter registration numbers from districts that fall into one of those specific categories.
- Sum_range: This tells Excel what cells to add, if you want to sum cells other than those specified in the range argument.
Summing 2010 Registered Voters by District Type (“RV2010”)
You’ll first use SUMIF to calculate the number of 2010 registered voters according to district type. We’ll start by summing the number of registered voters for urban districts, then move on to rural and the capital.
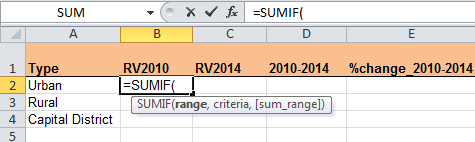
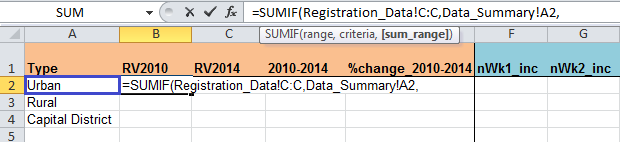
1. In cell B2 type “SUMIF(“ Notice that Excel automatically provides you with the information needed to complete the rest of the formula.
2. Now we need to specify the “range” for Excel to pull your criteria from. Since we’re looking specifically at district type, your range will be column C from the Registration_Data tab. To reference your range, leave your formula open and click on the Registration_Data tab in the bottom left-hand corner of your file. (Do not click Enter before you switch to the main data tab or else your formula will not continue to populate!)
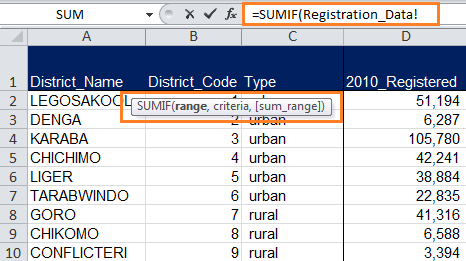
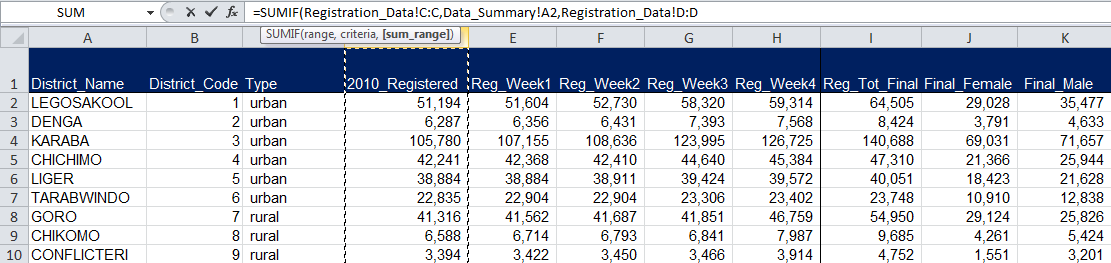
Notice when you come back to Registration_Data that your formula bar continues to update based on where you click. Excel sees that you’re trying to establish a connection between your SUMIF calculation on your Data_Summary tab and information on your Registration_Data tab.
To finish selecting the range, select all of column C by clicking the the top of the column. Again notice that Excel autopopulates your formula as you click.
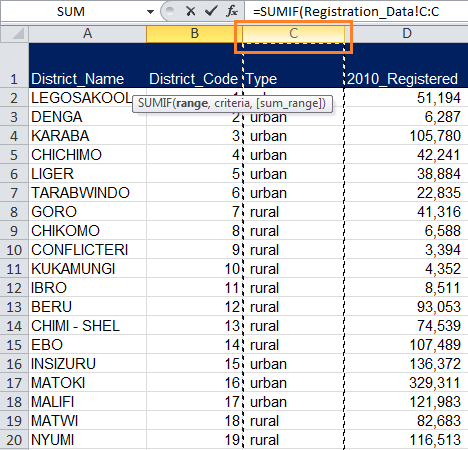
You’ve now selected your range! Type in a comma [,] and we’ll move on.
. SUMIF now requires that you select your specific criteria. Without hitting Enter, click back to the Data_Summary tab and click on cell A2 “Urban.” You just told Excel that you only want it to grab data from urban districts in Opendya, according to the Registration_Data tab.
Type another comma [,].
4. Last, we need to tell Excel what data to add up based on our criteria, urban. In this instance, we’re adding up registered voters from 2010. That information is stored in column D “2010_Registered” of our the Registration_Data tab. Leaving your formula open, click back to the Registration_Data tab and select all of column D.
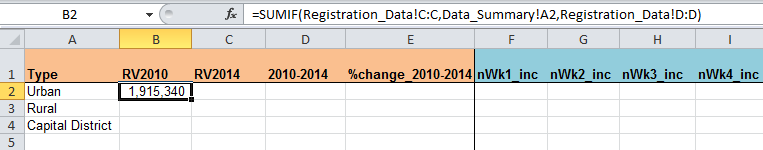
5. You can finally close your parentheses and hit Enter! According to your calculations, how many 2010 registered voters are from urban districts?
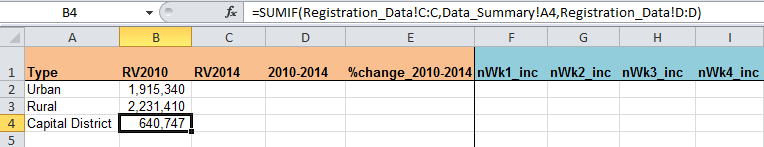
6. Now have Excel replicate your 2010 registered voters calculation for rural districts and the capital district. As a reminder, you can double click the box in the bottom right corner of cell B2 or you can manually re-enter the formulas using “rural” and “capital district” as your new criteria. Here’s what you should get.
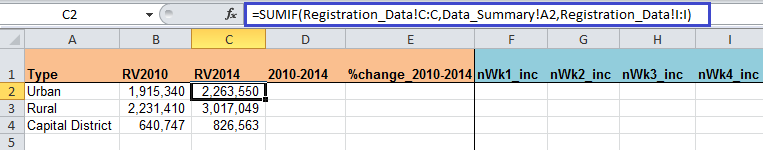
Summing 2014 Registered Voters by District Type (“RV2014”)
You guessed it! You’re going to use SUMIF again to calculate the final number of registered voters in 2014 in Opendya’s three types of districts. Think about the process you used above to calculate 2010 registered voters. How might that calculation equate or differ from the 2014 calculation?
1. Repeat steps 1 and 2 from above which tell you how to select the range and criteria for your SUMIF function. You’re still looking at column C “Type” and you’re still selecting a specific district type as your criteria.
2. Now, go to the Registration_Data tab and select all of column I “Reg_Tot_Final,” which houses the final 2014 voter registration totals for each district.
Here’s what your final calculations should look like:
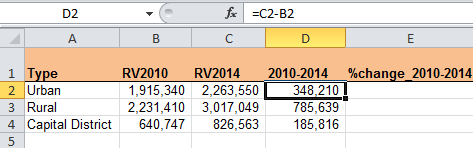
Difference between 2010 and 2014 Registration by District Type (“2010-2014”)
Now we would like you to calculate the difference in registered voters between Opendya’s 2010 and 2014 elections for specific district types. Think about data and Excel function you need to use to complete this calculation and go for it!
Here’s what your difference calculations should look like:
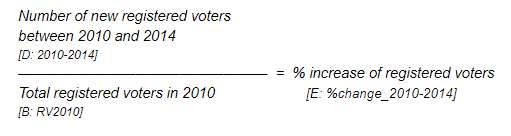
Percent Increase in Registration by District Type (Column E, “%change_2010-2014”)
Now that we know how many more voters were registered in each district type from 2010 to 2014, let’s calculate the percent change between election cycles. We did this same type of calculation earlier in this module (Calculating the percent increase in registration between 2010 and 2014), so this should be a breeze! Do you calculation in column E “%change_2010-2014”
If you’re having trouble remembering how to calculate the percent increase, click here.
Your calculations should look like this! 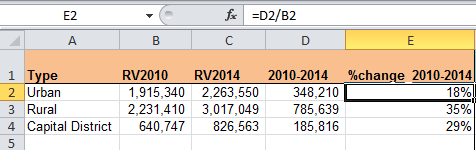
What do you see?
Now that you have completed your new set of voter registration calculations according to Opendya’s three district types, what do you notice? Do registration trends in specific types of districts stand out to you? What conditions on-the-ground may contribute to regional variations in registration rates?