4. Detecting Bias in Ballot Qualification
Using sample ballot qualification data in Module 4, you’ll enhance your ability to:
- use pivot tables and some more advanced features within them;
- employ the COUNTIF function for a variety of use cases;
- use basic operators in Microsoft Excel (including calculating percentages), and
- examine your data with a political eye.
Why Ballot Qualification Data?
The rules and conduct of the ballot qualification process can profoundly impact the quality and fairness of an election. Unfair ballot qualification requirements or uneven implementation of those requirements can result in an uneven playing field, where significant portions of candidates are disqualified and not allowed on the ballot. The rules and process of ballot qualification can be decisive in determining an electoral outcome. Thus, when ballot qualification data is made available, civil society organizations and citizens should be equipped with the knowledge and skills needed to make use of that data. Long before election day, such analysis can be critical in determining the credibility of a poll.
Ballot Qualification in Opendya
Here’s the political context for the dataset you’ll be analyzing in this module.
An island nation known as Opendya has both presidential and parliamentary elections approaching. Prospective candidates just submitted their names for approval by the election commission, and the commission has just released its decisions on which candidates were accepted and rejected. You were given a copy of the data with all ballot qualification decisions according to candidate, for both legislative and presidential candidates.
All candidates who applied to be on Opendya’s ballot hailed from one of three political parties: Draconia (the ruling party), Shireling (an opposition party), and Zalog (a new opposition party). There are rumors that Opendya’s newest opposition party, Zalog, has an alliance with the ruling party, yet those allegations have yet to be confirmed.
Reviewing the Ballot Qualification Data
To begin the exercise, download the ballot qualification data file here.
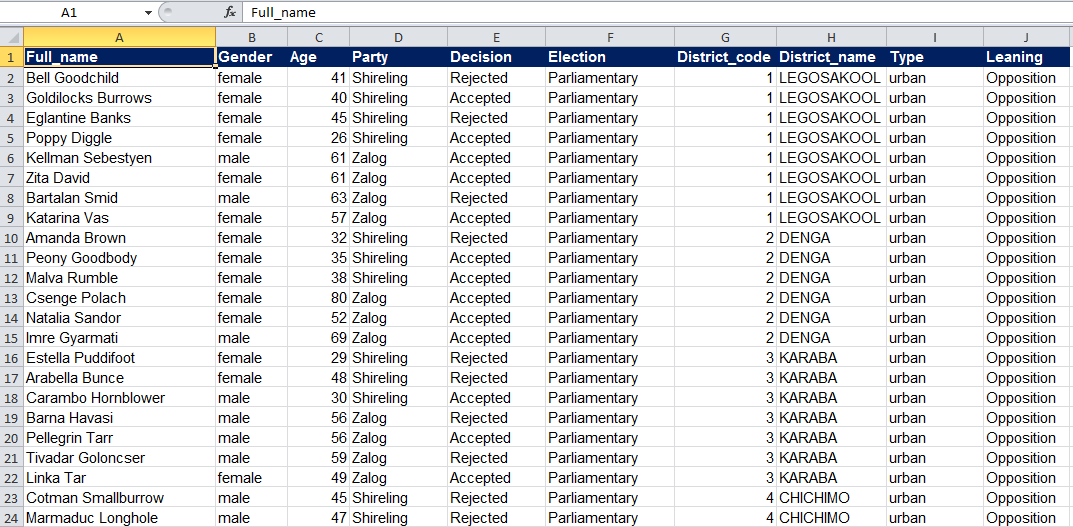
Before delving into analysis, let’s get familiar with the data available in the file.
Full_name
Column A, Full_name, appears to contain the first and last names of each prospective candidate.
Gender
Each prospective candidate’s gender is provided in Column B of your dataset.
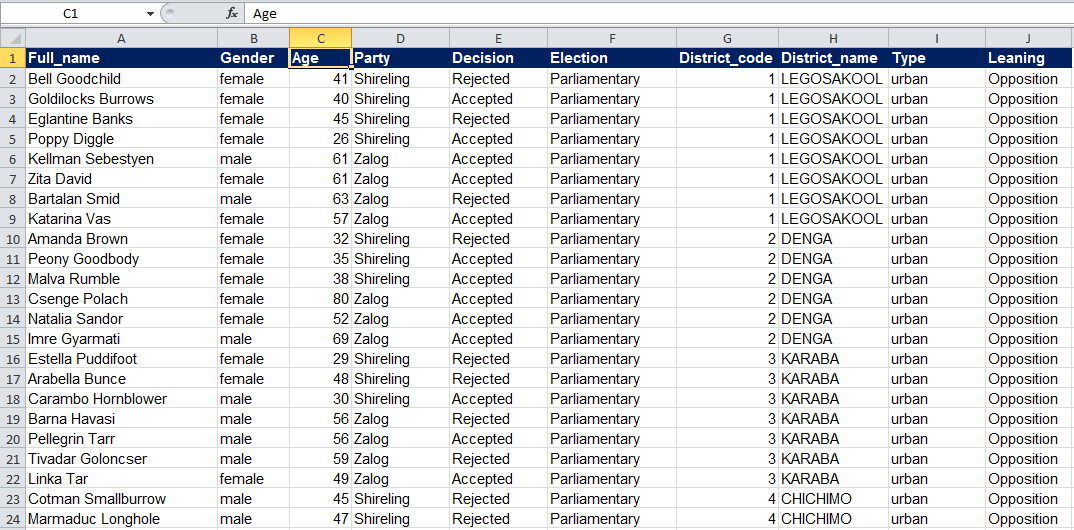
Age
The ages of all prospective candidates is in Column C of your dataset. Note that Opendya does not have age limitations for parliamentary or presidential candidates.
Party
Column D has the party name for each candidate.
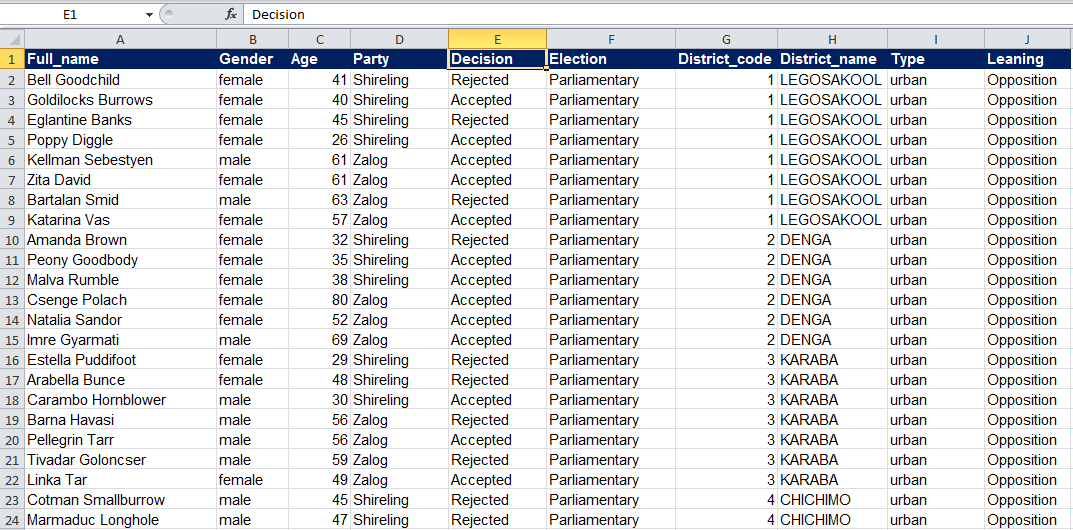
Decision
Column E, Decision, details whether an individual’s candidacy was “accepted” or “rejected” by the election commission.
Election
Column F, Election, indicates whether an individual applied to run in the parliamentary or presidential election.
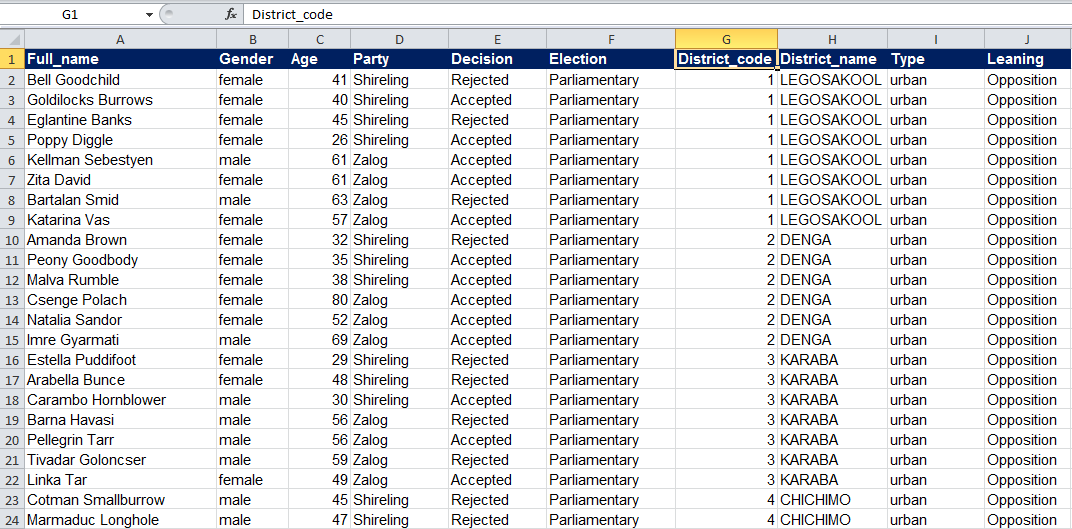
District_code
The Election Commission of Opendya assigns a code to each district. Take a quick second to scroll through the file and notice the pattern of how the districts are numbered.
As we mentioned in Module 2: Reviewing a Polling Station List, unique identifiers are extremely helpful when dealing with datasets. They help us catch duplicate entries and/or properly distinguish between units with similar names.
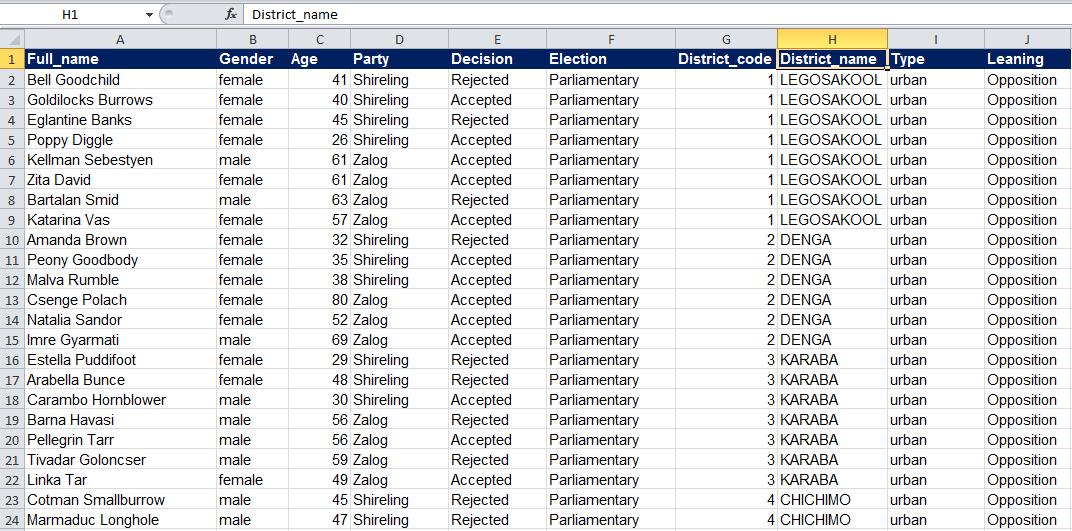
District_name
Column H contains the names of all districts in Opendya. Notice that this is the only geographic level provided in the dataset. At this stage, we have no further indication as to whether these districts are nearby one another or if they fall under the same geographic units at a higher level.
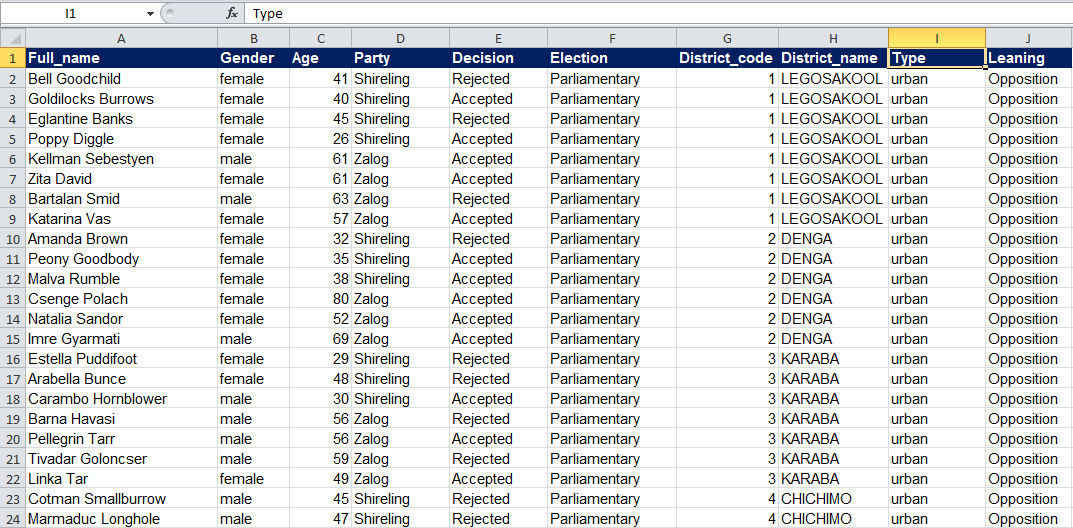
Type
The Type column indicates the characteristics of Opendya’s districts. Check through the data to review what descriptors are used to indicate the type of district. What different types do you see?
Assessing Party Age Demographics
Calculating the average age of prospective candidates in Opendya will give you a sense of demographic differences between the political parties. To calculate average age (ie. the “mean”) of individuals who applied as candidates, according to political party, we’re going to make a pivot table. Your use of the pivot table function in this exercise will build on your skills from Module 2.
What do you expect to see?
Given what you know about the three political parties competing in the upcoming elections, what trends in average candidate age might you expect to see?
Follow these easy steps to make your pivot table.
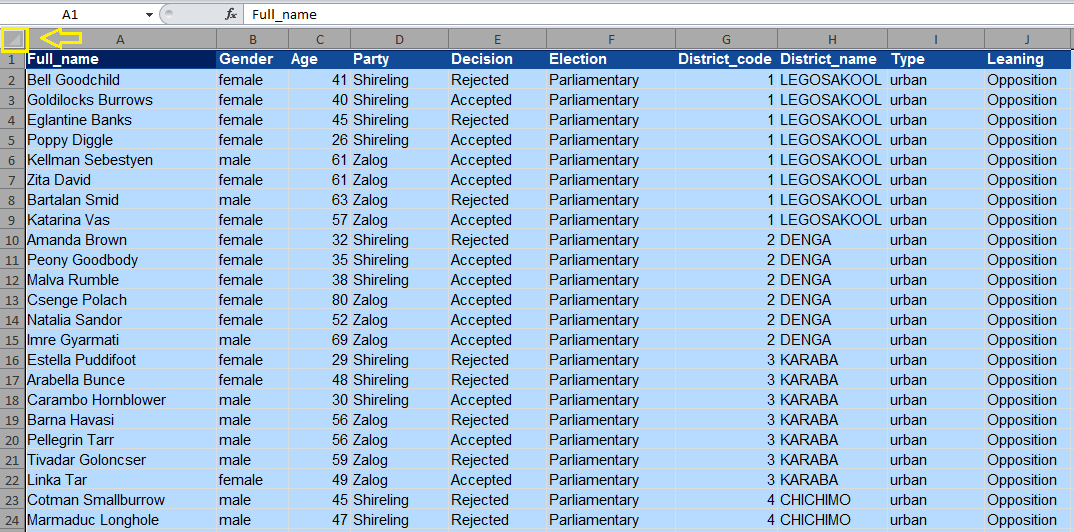
1. Select All
To begin, you’ll need to select all of the data in the “Candidate_Information” tab of your spreadsheet. To do so, click on the top left square of the sheet containing the little triangle. You could also click cell A1 ("Full_name") and then click Control+A (i.e., hold down the "Ctrl" button while also pressing the "A" button on the keyboard).
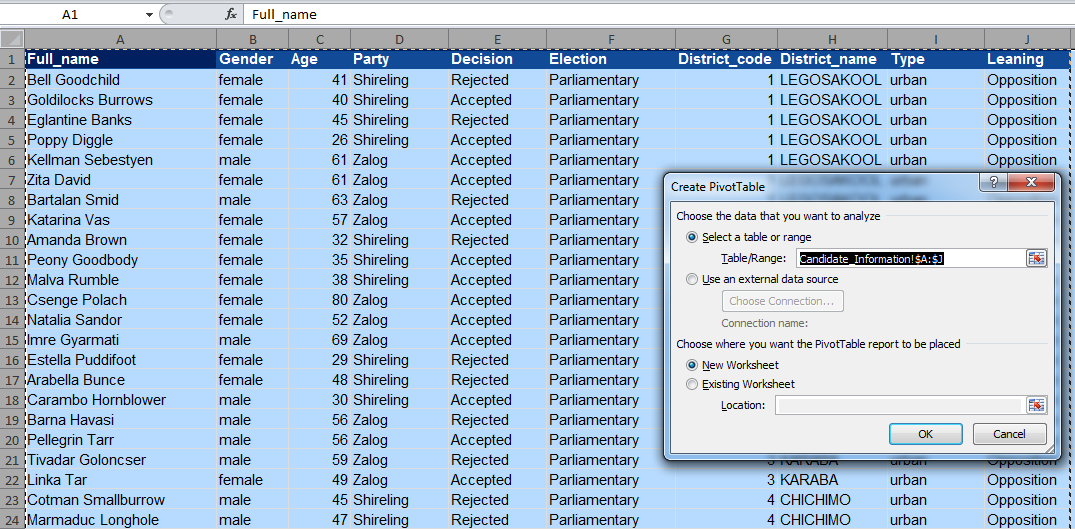
2. Inserting your Pivot Table
Now all of the data is selected. [If you are using Excel 2013], click on the "Insert" tab in the top menu and then click "Pivot Table" along the left. A pop-up window will appear that says "Create Pivot Table.” Leave the options as their defaults and just click "OK", and Excel will make a new pivot table in a new worksheet.
3. Sorting by Party
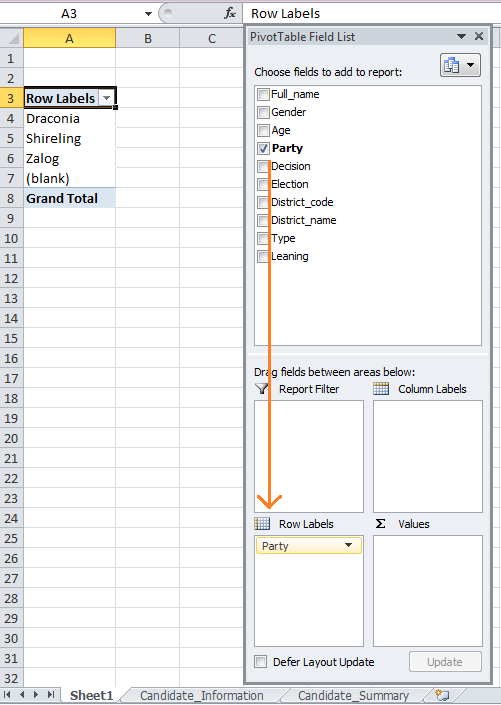
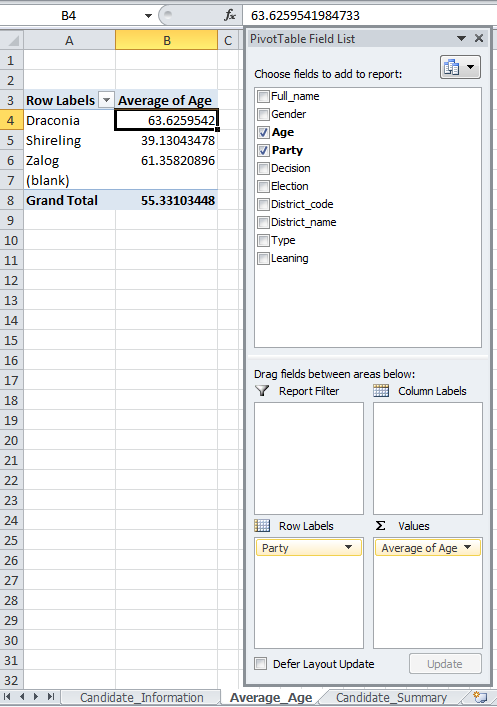
Now that your skeleton pivot table is ready, we can make some calculations. On the right is a window titled "Pivot Table Field List." Click on "Party" and drag/add it to the "Row Labels" area. This will sort everything by whatever value is listed in the "Party" field. Notice that "Party" is now listed in the lower right window called "Row Labels." If done correctly, we'll get all three of our parties loaded into Column A.
4. Determine average age
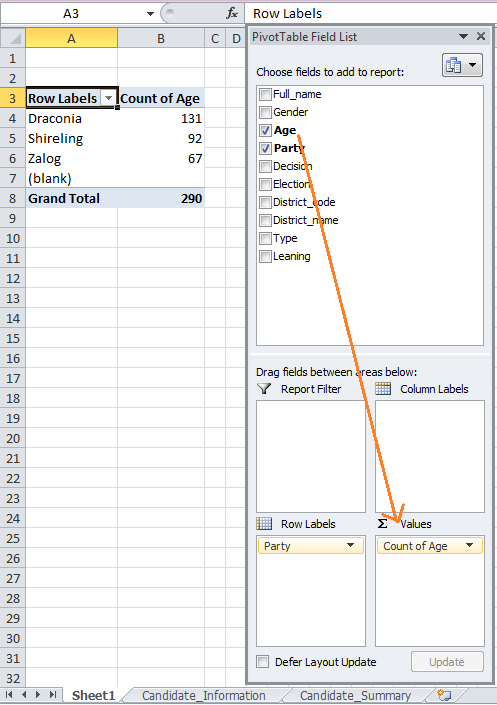
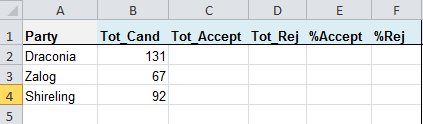
Next, let's check out the age composition of Opendya’s three parties: Draconia, Shireling and Zalog. Take "Age" and drag and drop the field into the "Values" section on the bottom of your Pivot Table Field List. If all goes well, the pivot table should default to showing a count all of the cells that have a value for "Age" according to political party. You can check this by hovering your mouse pointer over the values in Column B, and a note should say "Count of Age." Notice that now "Count of Age" is listed in the lower right window under "Values." If you've done it correctly, it should display 131 for Draconia, 92 for Shireling, and 67 for Zalog. See the image below for confirmation.
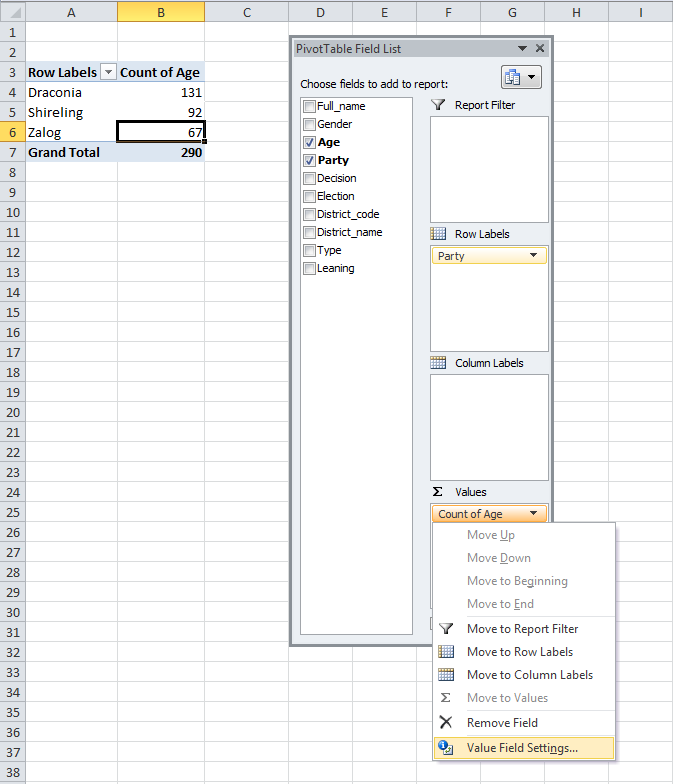
Next we need Excel to show us the average age of candidates instead of counting the number of cells with a value for “Age.” To do so, we’ll go to "Count of Age" in the "Values" window in the lower right of the screen, and click the arrow pointing down.
This will give us a window where we can click "Value field settings," like you can see below Under "Summarize Value Field By" choose "Average." Excel will average the age of prospective candidates according to political party.
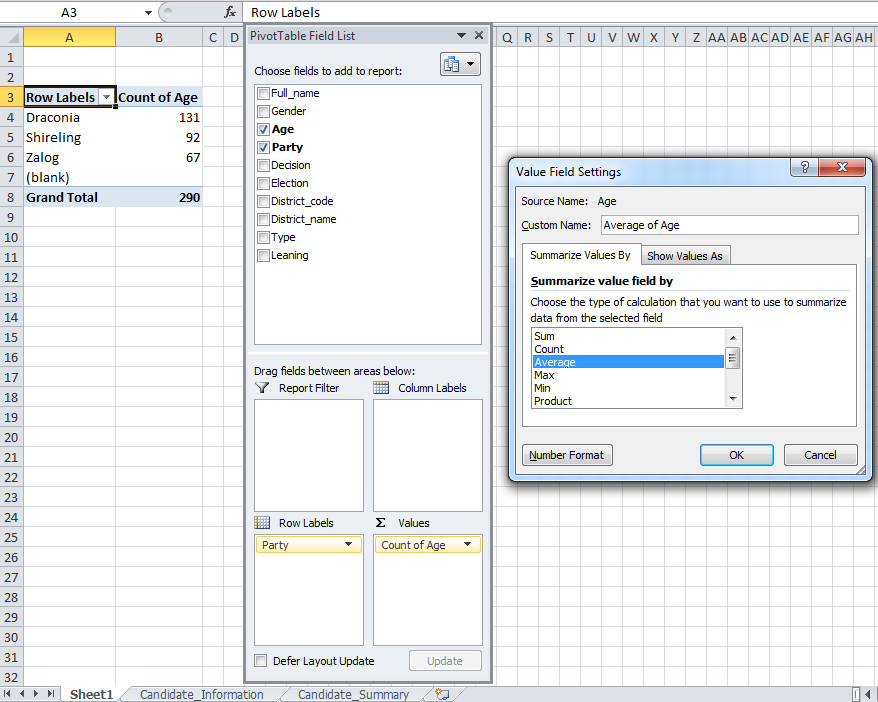
As a data cleanup measure, we’ve re-labeled this entire data tab as Average_Age. If you prefer to view your average age calculations without the decimal points, you can In your “Value Field Settings” window, select the “Number Format Option”. Select “Number” and adjust the number of decimal points to 0, or whatever number of points you would like to see.
What do you see?
What trends or differences do you notice in the average age for each of Opendya’s three parties. Which party would you guess is new just based on this information?
Analyzing Overall Ballot Qualification Decisions
Reviewing the Candidate_Summary Tab
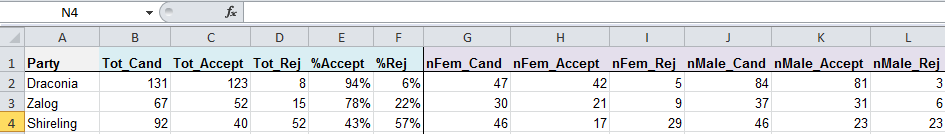
For this portion of the module, we’re going to start using the Candidate_Summary tab in your Excel file. This tab will pull a summary of calculations based on data from the Candidate_Information tab. It looks like this:

To speed things up, we’ve pre-populated all of your column headers for you, which will house all of the different calculations you’ll need to do. Let’s get started with some more complex formulas and calculations!
Using COUNTIF and COUNTIFS to count the number of cells that meet your criteria
For the remainder of Module 4, we’ll make frequent use of the COUNTIF and COUNTIFS functions. Both COUNTIF and COUNTIFS count the number of populated cells that meet the criteria you’re looking for. For this exercise, we’ll use these formulas to add up instances where prospective candidates were either accepted or rejected by Opendya’s election commission, according to the three different political parties. Note that the COUNTIF function only works with one range and criteria. COUNTIFS is able to count cells that meet multiple criteria.
Here’s how the formula is structured: COUNTIF(range, criteria) OR COUNTIFS(range_1,criteria_1,range_2,criteria_2,range_3,criteria_3,...).
- Range: Range specifies the group of cells you want to count from.
- Criteria: Your criteria will indicate whether or not a number should be counted. Criteria can come in the form of a number, expression, a cell reference, text, or a function that defines which cells will be added.
Let’s give COUNTIF and COUNTIFS a try!
Counting prospective candidates according to party (Tot_Cand)
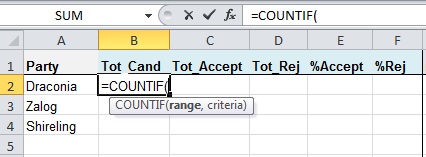
You’ll begin your journey into COUNTIF by calculating the number of individuals that attempted to register as candidates according to political party. We’ll do this in column B, Tot_Cand. Let’s start by counting the number of prospective candidates for the Draconia party, then move on to Shireling and Zalog.
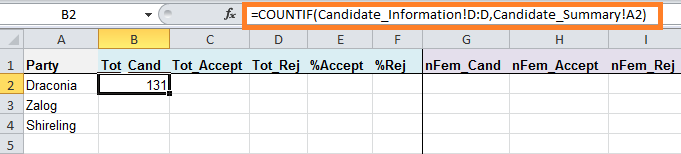
1. In cell B2, type “=COUNTIF(“ Notice that Excel automatically provides you with the information needed to complete the rest of the formula.
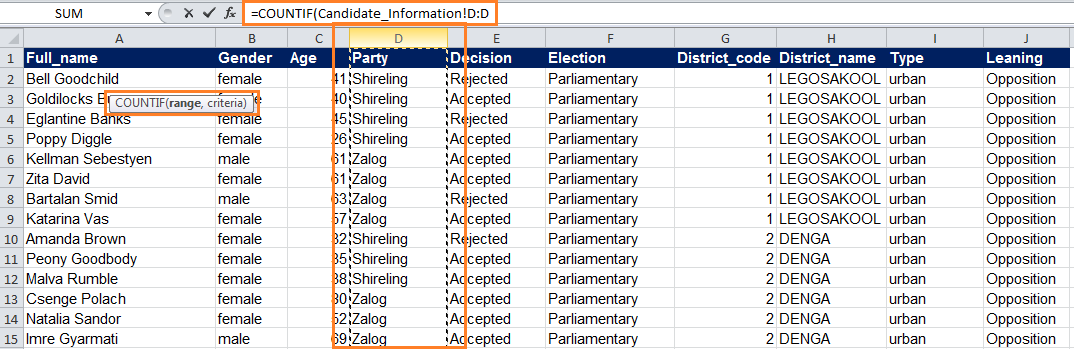
2. Now we need to specify the “range” for Excel to pull your criteria from. Since we’re looking specifically at political parties, your range will be column D from the Candidate_Information tab. To reference your range, leave your formula open and click on the Candidate_Information tab in the bottom left-hand corner of your file. (Do not click Enter before you switch to the main data tab or else your formula will not continue to populate!)
Notice when you come back to the Candidate_Information tab that your formula bar continues to update based on where you click. Excel sees that you’re trying to establish a connection between your COUNTIF calculation on your Candidate_Summary tab and information on your Candidate_Information tab.
To finish selecting the range, select all of column D by clicking the the top of the column (the letter “D”). Again notice that Excel autopopulates your formula as you click.
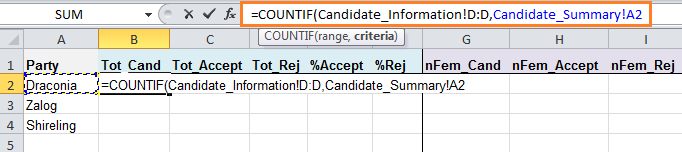
Now, you’ve selected your COUNTIF range! Type in a comma [,] and we’ll keep going.
3. COUNTIF now requires that you select your criteria. Without hitting Enter, click back to the Candidate_Summary tab and click on cell A2 “Draconia.” You just told Excel that you only want it to count candidate data that applies to the Draconia party only.
4. Close your parentheses [)] and hit Enter. Using COUNTIF, you’ve just calculated the number of Draconia-affiliated individuals who applied as candidates for Opendya’s upcoming election!
5. You now need to replicate this calculation for both the Zalog and Shireling parties. To do so, you can double click the box in the bottom right corner of cell B2 or you can manually re-enter the formulas using cells B2 (Zalog) and B3 (Shireling) as your new criteria. Here’s what you should have.
Counting “accepted” candidates per party (Tot_Accept)
Next we would like to calculate the total number of applicants that Opendya’s election commission “accepted” as candidates for the upcoming elections, according to party. Here, you’ll need to use the COUNTIFS formula as we are now counting cells based on two criteria instead of one. You need Excel to count:
- 1.candidate applicants from a specific political party, and
-
- accepted candidates.
The formula will essentially look like two regular COUNTIF formulas in one: COUNTIFS(range_1, criteria_1, range_2, criteria_2). Note that the first half of this formula will look just like our calculation for the Tot_Cand column, as we’re still counting according to political party. Let’s begin our calculation in column C, Tot_Accept.
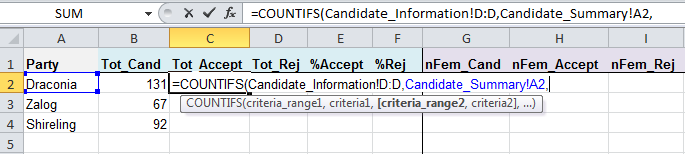
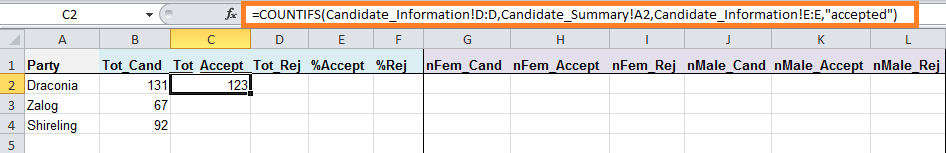
1. In cell C2, repeat steps 1 and 2 from your last calculation (Tot_Cand) which tell you how to select the range and criteria. However, remember to type “=COUNTIFS” instead of “=COUNTIF.” Your first range is still column D “Party” from the Candidate_Information tab, and your first criteria will be the Draconia party (cell A2 in the Candidate_Summary tab).
If you need, scroll down for an image of what this step should look like.
Don’t hit Enter or close your parentheses just yet! Instead, type a comma [,] and let’s move on to the second part of the formula.
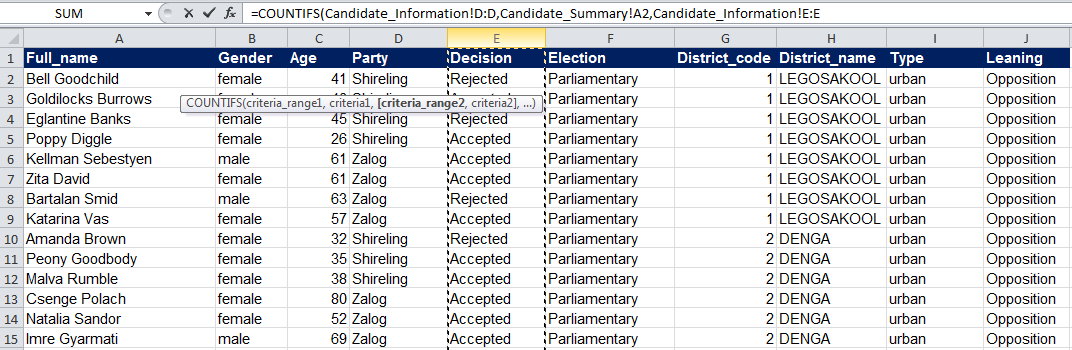
2. Remember we’re currently calculating the number of accepted candidates from Draconia. Our existing formula is ready to pull all candidates from the Draconia party, but we still need to distinguish the “accepted” candidates from the “rejected.” To do so, we’ll need to specify a second range and second criteria. Since we’re sorting out accepted vs. rejected, our range is column E “Decision” from the Candidate_Information tab. Click the Candidate_Information tab and select all of column E. Your formula should look like this.
3. Type a comma [,]. Now we’re ready to specify our second criteria – accepted candidates. To do so, type “accepted” including the quotation marks.
4. Close your parentheses and hit Enter. You’ve just completed your first COUNTIFS calculation! It should look like this.
5. Now repeat this calculation for both the Zalog and Shireling parties! Scroll down if you need a tip on how to do this. Take a look at what your final calculations should come to.
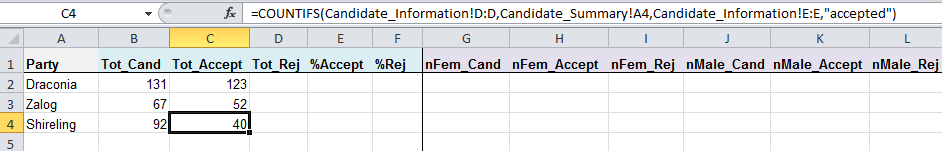
Double click the box on the bottom right hand corner of cell C2!
Counting “rejected” candidates per party (Tot_Rej)
On the flip side, it’s important for us to understand how many applicants were rejected as candidates, per party. This calculation will look almost exactly the same as column C “Tot_Accept,” albeit with one major difference.
1. Repeat steps 1 and 2 from your last calculation.
2. Type a comma [,] and consider how you need to phrase your second criteria for this calculation in order to count only candidates that were rejected by Opendya’s election commission.
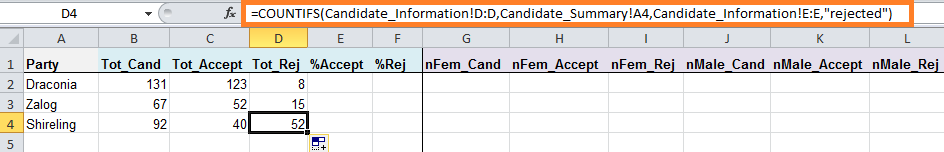
We hope you typed “rejected” (including those quotation marks)!
3. Hit Enter and replicate the calculation for the remaining two political parties. Here’s what you should have.
Calculating percent of candidates accepted (%Accept)
While we have figures for total, accepted, and rejected candidates for Opendya’s three political parties, calculating percentages of acceptance and rejection will tell us what share of each party’s proposed candidates were or were not able to run for office. Given what you know about the totals for those figures, take a moment and ask yourself: what percentages might you expect to see for accepted?
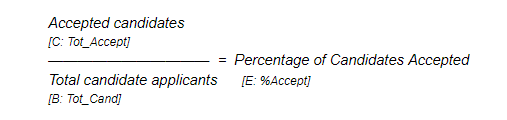
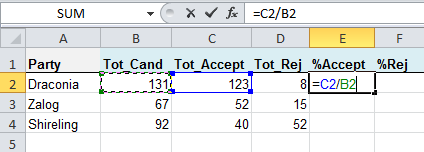
Let’s start by calculating the percent of candidates accepted by the election commission, per political party. In column E, %Accept, of your Candidate_Summary tab, you’ll need to use a simple division formula. Specifically we need to divide column C, Tot_Accept, by column B, Tot_Cand. Here’s the mathematical logic for this calculation.
1. In cell E2, type an equals sign [=]. Then click on cell C2. You’ll notice that Excel automatically adds the term “C2” to your formula (listed in the formula bar) once you click on that cell. Alternatively, you could simply type in the term “C2” and Excel will automatically link to that cell.
2. Next, type a forward slash [ / ] which tells Excel that you would like to divide cell C2 by something else. Now click on cell B2 to tell Excel that you would like to divide the contents of cell C2 (accepted candidates from Draconia) by cell B2 (total candidate applicants put forth by Draconia).
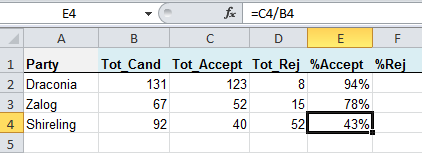
3. Click “Enter” and Excel will calculate the candidate acceptance registration rate for Draconia for you. What is the acceptance rate?
4. Repeat this calculation for both the Shireling and Zalog parties. Here’s what you should have.
Note if your cells did not populate as percentages, you may need to change the cell formatting. Click the letter “E” to select the entire row. Right click and select “Format Cells.”
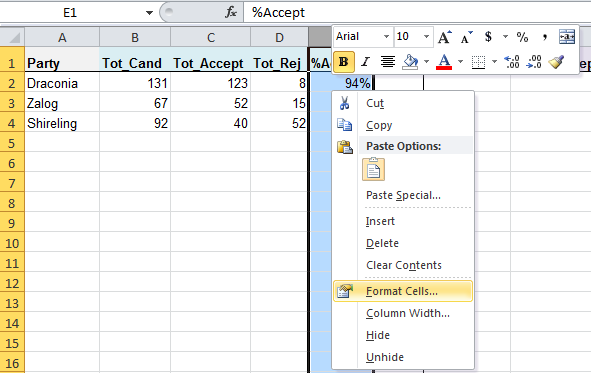
Select “Percentage,” adjust the decimal places as you would like and click OK.
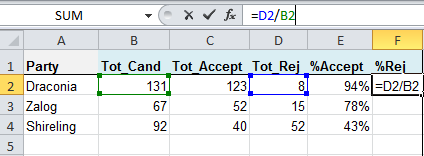
Calculating percent of candidates rejected (%Reject)
This next piece of analysis is similar to your last calculation for %Accept. What columns do you think you’ll need to work with to calculate the percentage of candidates rejected? We hope you guessed columns D and B, Tot_Reg and Tot_Cand!
Go ahead and make this calculation on your own. Scroll down if you need help with the formula.
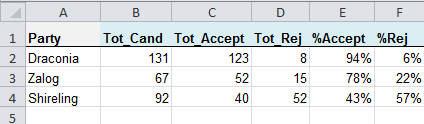
Here are your answers.
What do you see?
You just made five important calculations about ballot qualification in Opendya! What trends do you notice about the number of candidates put forth by each political party, the number/percentage of accepted candidates, and the number/percentage of rejected candidates.
Findings: Did you notice that the opposition candidates were rejected at higher rates (especially Shireling party)? Did you see that the ruling party put forth a lot more candidates overall?
Analyzing Ballot Qualification Decisions By Gender
A. Calculating Net Candidate Figures by Gender
Understanding the gender demographics of Opendya’s proposed candidates (both accepted and rejected) will give us a clearer indication of whether parties are representative of both men and women. It will also help us understand if men and women have an equal opportunity to run for office through the ballot qualification process.
We’ll begin by calculating net figures for the number of men and women who applied as candidates, were accepted, and were rejected. Then we’ll tackle some percentages.
Number of female candidates per party (nFem_Cand)
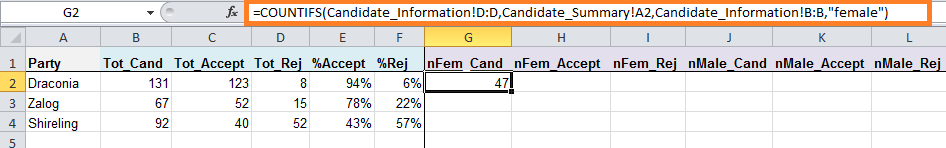
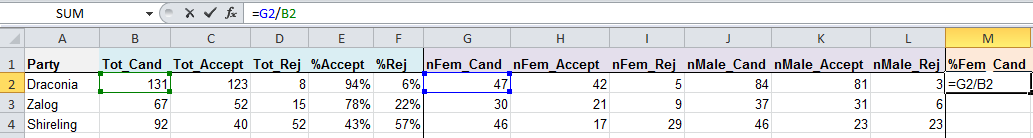
In column G of your Candidate_Summary tab, we’ll calculate the number of female candidates proposed by each political party in Opendya.
What formula do you need to make this calculation?
If you guessed COUNTIFs, you are correct! Now, what are your ranges and your criteria? Take a moment to work the formula out on your own. If you need help, scroll down.
Here are your ranges and criteria for this calculation:
- Range_1 : Party, column D, Candidate_Information tab
- Criteria_1 : Draconia (subsequently, Zalog and Shireling), cell A2, Candidate_Summary tab
- Range_2 : Gender, column B, Candidate_Information tab
- Criteria_2: “female”
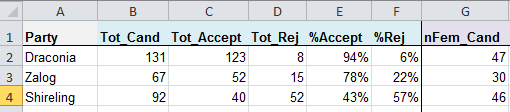
Once you’ve finished calculating the number of female candidates across all parties, check your responses below.
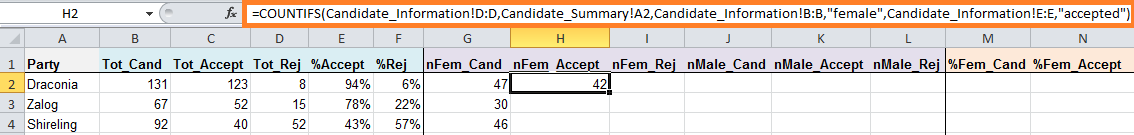
Number of accepted female candidates per party (nFem_Accept)
Now we’re going to calculate the number of accepted female candidates according to political party. This is your first COUNTIFS calculation where three different ranges and criteria are required. You’re counting cells based on: 1) political party, 2) gender, 3) acceptance as candidates.
1. Repeat your entire formula for cell G2, nFem_Cand, to specify that Excel should count only female candidate applicants from Draconia. Do not close your parentheses or hit Enter just yet! Instead, add a comma [,] to add your third range and criteria.
2. You still need to specify that you’re looking for only accepted candidates. Click over to the Candidate_Summary tab and select all of column E, “Decision.” Type a comma [,].
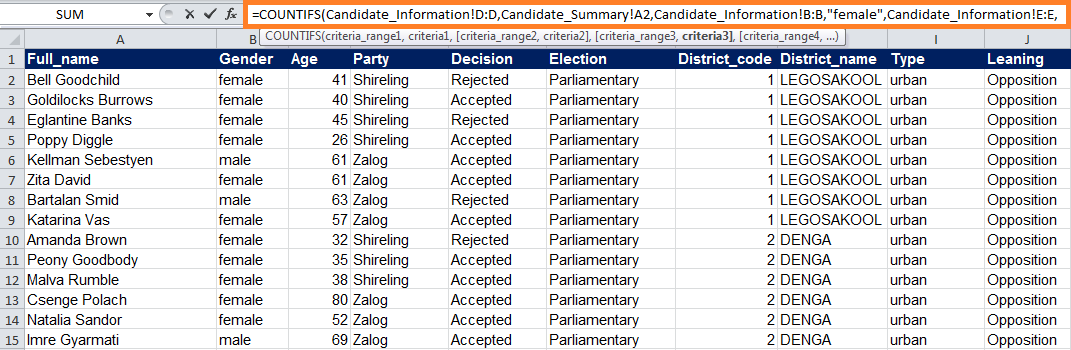
3. Now add your final criteria. Type “accepted” (with quotations) into your formula bar. Close your parentheses [)] and hit Enter. Success! You’ve mastered the triple COUNTIFS function!
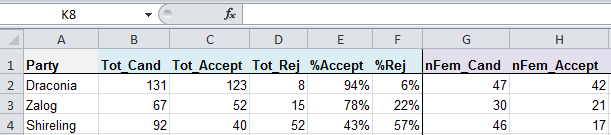
4. Replicate your formulas for the remaining political parties and check your work below.
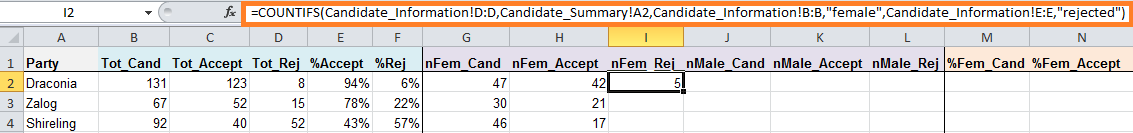
Number of rejected female candidates per party (nFem_Rej)
Now that you’re a pro at COUNTIFS, calculate the number of rejected female candidates for each of the three parties. Scroll down if you need a little help sorting out your ranges, criteria, or overall formula.
Here are your ranges and criteria for this calculation:
- Range_1 : Party, column D, Candidate_Information tab
- Criteria_1 : Draconia (subsequently, Zalog and Shireling), cell A2, Candidate_Summary tab
- Range_2 : Gender, column B, Candidate_Information tab
- Criteria_2: “female”
- Range_3: Decision, column E, Candidate_Information tab
- Criteria_3: “rejected”
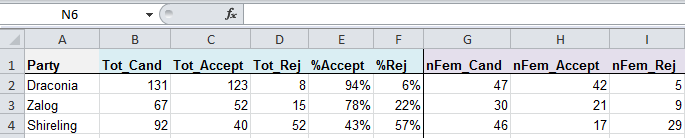
Check your responses below!
Number of male candidates per party (nMale_Cand), Number of accepted male candidates per party (nMale_Accept), and Number of rejected male candidates per party (nMale_Rej)
We think you’ve got these calculations covered! Think back to your calculations for columns G (nFem_Cand), H (nFem_Accept), and I (nFem_Rej), and make the necessary formula adjustments for male candidates only. Scroll down for a hint.
Remember to alter your second criteria to “male” for each calculation! That’s about all you need to change.
Here’s what your calculations should come to.
B. Calculating Percentage Candidate Figures by Gender
You’re almost at the finish line! Last, we’d like you to calculate the acceptance and rejection rates of male and female candidates in Opendya, across political party. This will give us a sense of how evenly male and female candidates were accepted and rejected by the election commission.
Percent female candidates per party (%Fem_Cand)
Here’s a simple calculation. To start, we’d just like to know the percent breakdown of male and female candidates for each political party. Again, take a moment to make a guess about the percentages? Using your experience and instincts, do you think there will be a higher percentage of candidates will be men or women? What data fields do you think we’ll need to work with to make the calculations?
Yes indeed, it’s nFem_Cand (column G) and column Tot_Cand (column B). Here’s the logic.
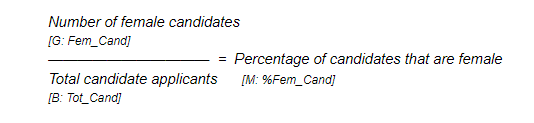
Scroll down if you need help working out the formula.
What percentage of proposed candidates from Draconia are women? We hope you calculated 36%! Now do the same calculation for the other two political parties. We’ll show you all of the responses after you finish a few more percentages.
Percent female candidates accepted (%Fem_Accept)
Now we’re going to get a sense of the proportion of female candidates accepted by the election commission, according to party.
Think through this calculation on your own or scroll down if you need some help.
Divide the number of accepted female candidates (column H, nFem_Accept) by the number of female candidates (column G, nFem_Cand)!
Percent female candidates rejected (%Fem_Rej)
Similarly, let’s see what percentage of female candidates were rejected across different political parties. Before you do the calculation, given what you know from the percentage of women accepted, what do you expect the rejected percentages to look like?
If you need some help with the calculations, scroll down.
Divide the number of accepted female candidates (column I, nFem_Rej) by the number of female candidates (column G, nFem_Cand)!
Percent male candidates per party (%Male_Cand), percent male candidates accepted (%Male_Accept), and percent male candidates rejected (%Male_Rej)
Complete calculations for your final three columns pertaining to male candidates using similar logic to your calculations for women’s acceptance and rejection. As a reminder, you’re calculating each political party's respective share of male candidates (%Male_Cand), the percentage of male candidates accepted within each party (%Male_Accept), and the percentage of male candidate rejected from each party (%Male_Rej).
Check out all of your answers for this component of the module below!

What do you see?
You’ve completed an impressive number of calculations! Think about what trends you expected to see regarding the acceptance and rejection rates of male and female candidates across Opendya’s three parties. Did your expectations pan out? What did you find surprising? What gender-related trends in the ballot qualification process do you see based on your analysis?
Scroll down to see some findings:
Findings: Women candidates were more frequently rejected across the board.