3. Application: Summarizing the Polling Station Data
In this tutorial we are going to review the five major steps in the process of analyzing data. Then we will look at some tips for handling data and data files. Finally, using the polling station list from Module 2, we will run through a practical exercise where we use what you learned in Module 1 to summarize the "Registered_Voters" variable.
Five Major Steps in the Data Analysis Process:
Step 1: Start with a question or a specific purpose.
Take some time to think about why you are looking at the dataset. Think about what you expect to see and what you do not expect to see in the data. Force yourself to be specific about your purpose and that will help you be much more efficient about the following steps in the process. For example, here are some of the questions we might want to answer by looking at the polling station list from Module 2:
- Does the polling station list look complete?
- Does the polling station list look correct or "clean"?
- What is a typical amount of voters registered at each polling station? What is the spread?
- What does the distribution of polling stations look like across different geographic areas?
- Have these distributions changed across time from list to list (if you have multiple lists)?
- Can you use the polling station list to draw a sample?
Step 2: Get the data.
Now that you have thought about the reason you are starting the data analysis process, it's time to get the data you need. Remember to save an untouched copy of the data somewhere before you begin to do anything with the data.
Step 3: Wrangle and clean the data.
Experienced data analysts know that 80% of the entire data analysis process is actually spent converting, cleaning and/or reformatting data. First, you should look through the data and try to determine if data appears to be missing or if there appear to be any mistakes in the data. Then, you often need to 'wrangle' the data by making the structure more consistent. For example, some or all the variables for each row might be merged into the same column (e.g., the data for "city" and "province" might be included in the same column, so you would need to separate the city and province data into two separate columns). The data may not be in a format that is analyzable. Put another way, the data may not be "machine readable," so you may need to figure out how to convert it. Recall from Module 2 that the 2008 polling station data was originally stored in several PDF files. We converted the information in those files into a machine-readable format for you (e.g., CSV and XLS files). It could be that you need to merge or join the data from two different datasets into one before you can analyze it.
Step 4: Summarize the variables of interest in your data.
For each variable of interest, you want to be able to answer: what is typical for the data, and what is the spread of the data? In Module 1 we covered how to calculate what was typical (i.e., center or average) for the animal height variable and how the data was spread using the standard deviation.
Step 5: Repeat.
The data analysis process is usually an iterative process. Once you finish your first pass at summarizing some variables, you may realize that you need to wrangle the data (e.g., merge it with another dataset) before you can do further analysis. Summarizing the data may lead you to a new purpose for analysis which, in turn, takes you back through the process.
In order to keep this module short and digestible, we are going to skip right to Step 4 in the data analysis process. We are going to assume that you know your specific questions and purpose, you have the data, and you have it in the right format (lucky you). Before we jump into the practical exercise, let's review some tips for handling data.
Data Handling Tips
- Make a working copy that is separate from the untouched original source file/data. You will want to make sure you can always go back and verify the original data.
- If you are using a spreadsheet file, put your calculations on a separate sheet or tab from the data.
- Document the steps in your process. This is so you can re-create your steps and figure out where a formula may have "gone wrong." This also helps you to know how you may have changed the data before performing calculations.
- Be very, very, very careful whenever you use the Sort Data function. Make sure you have highlighted everything. To be safe, never use the Sort function.
- Do not merge cells. It might make things look nicer, but if you need to automate and/or re-arrange the data (e.g., change the layout), then merged cells will make life difficult. Instead use colors and remove cell borders as a way to make things look cleaner.
Now that you know how to practice good data hygiene, let's re-examine that polling station list from Module 2.
Practical Exercise: (Re)Examine the Polling Station List using Excel
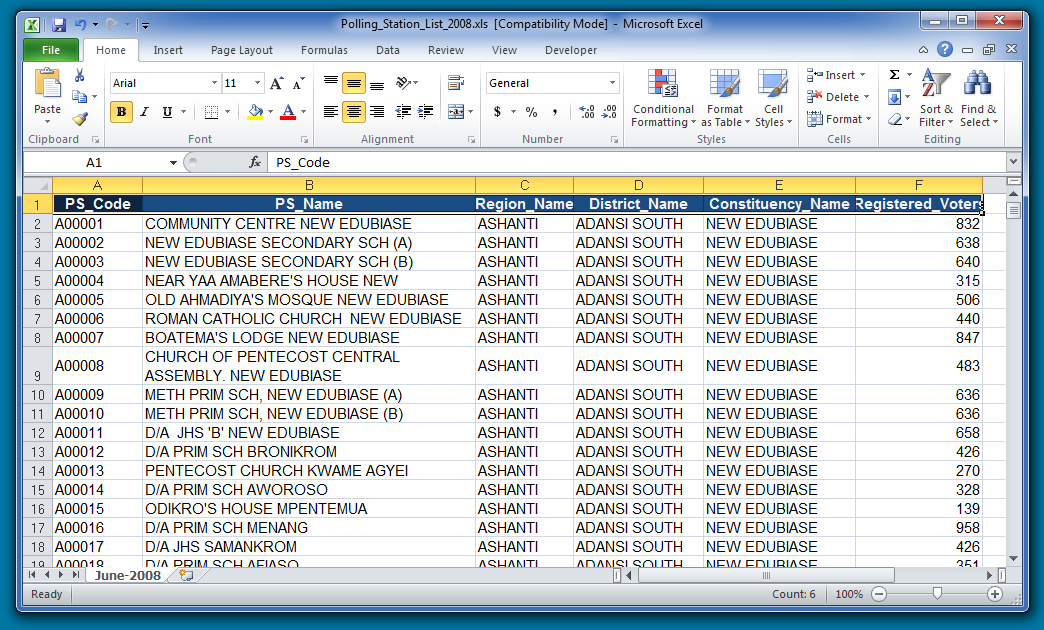
In the second module of Election Data Academy, we examined a polling station list (in XLS format). In theory, the file is supposed to contain the list of all polling stations in a country.[1] Open that file and take another look at the data. As you scroll through it, ask yourself these questions:
- Does it seem like anything is missing?
- Is the data structured in a way that makes sense?
- What is in each row?
- What is in each column?
- Are any of the cells merged?
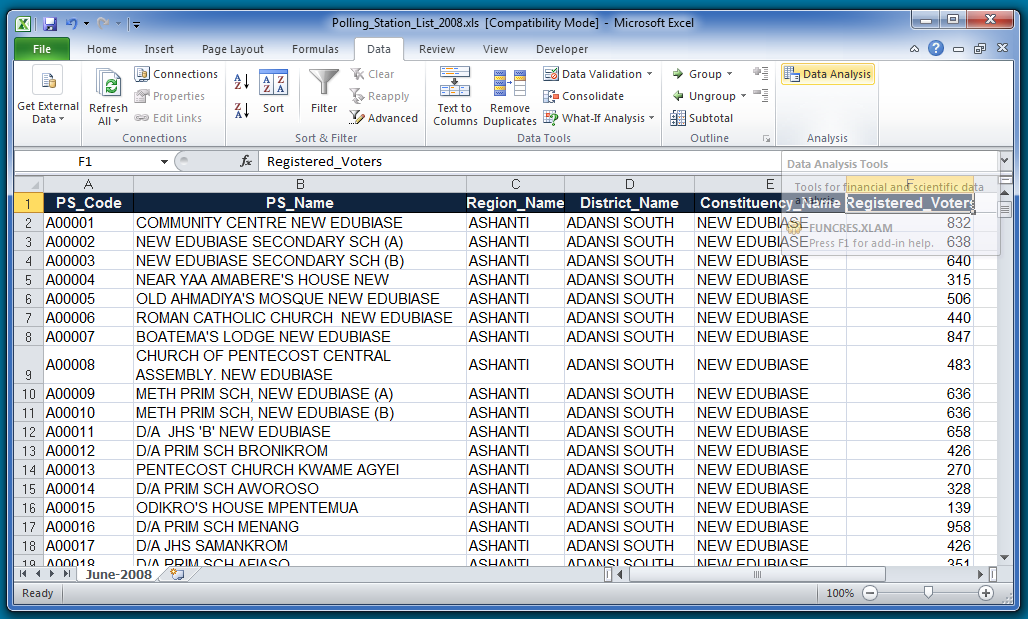
The first row of the file contains the names of the variables. There are six variables in this dataset: PS_Code, PS_Name, Region_Name, District_Name, Constituency_Name, and Registered_Voters.
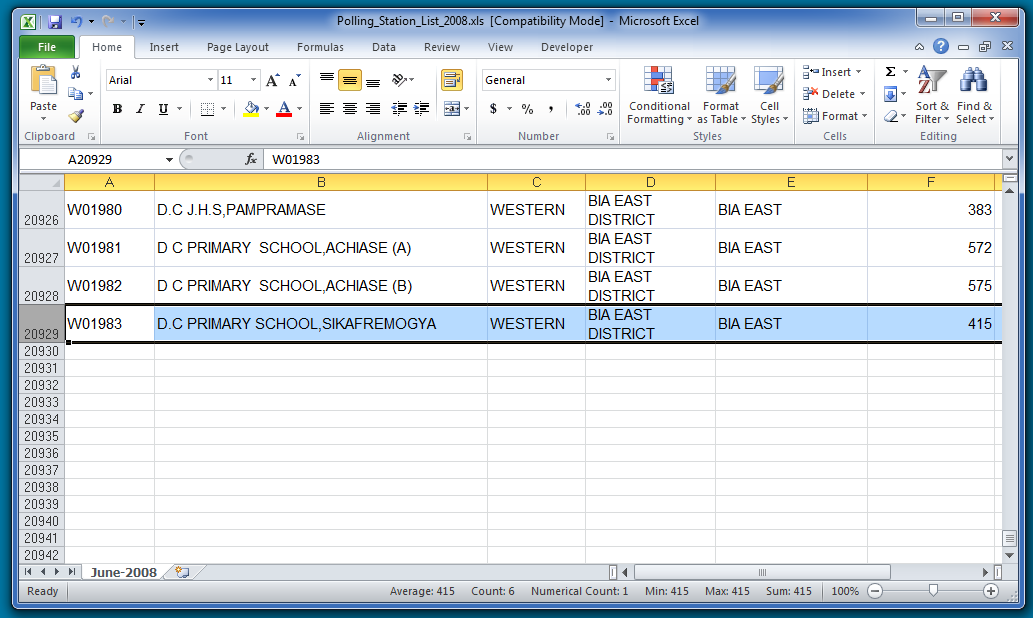
Next, let's figure out how many observations there are in this dataset. To do this we can either scroll to the bottom and subtract 1 (for the row with the variable names):
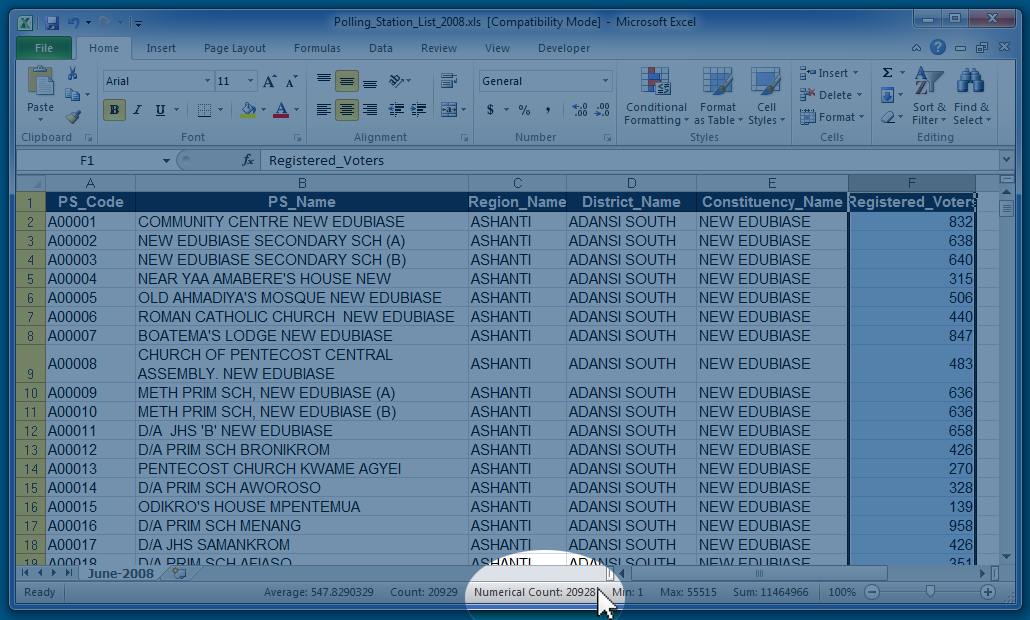
Or, we can highlight a column (e.g., one of the variables, like registered voters) and look at the lower right of screen to see the number after "Numerical Count." The "Numerical Count" does just what you would guess: it only counts the numbers and ignores any text.
If, for some reason, "Numerical Count" is not listed on that bottom status bar, right click on the bar and choose "Numerical Count" as one of the statistics to display.
There are 20,928 observations for the variable called "Registered_Voters." Next, we're going to focus on that Registered Voters variable.
Check Your Expectations: "Registered_Voters" variable
Column F contains the number of registered voters for each polling station (i.e., row). Before we summarize the Registered Voters variable, let's take a moment to think about what we expect to see. Ask yourself some questions, such as:
- What do you expect are the possible values?
- What do you think the center, or average, will be?
- What do you think will be the smallest number of registered voters for a polling station?
- Do you expect to see any observations with a zero? Do you expect to see a negative number?
- What is the largest number of registered voters you expect an individual polling station to have?
- What value or values would not make sense or seem unlikely? Would a number with a decimal make sense (e.g., "12.5")? What would be strange?
Using Excel to Describe the "Registered_Voters" Variable
If you highlight the column with the "Registered_Voters" variable (Column F), you can have Excel automatically calculate and show certain values for the highlighted/selected cells in the lower right status bar. Again, you may need to right click on this bar and customize the statistics it shows by checking each one.
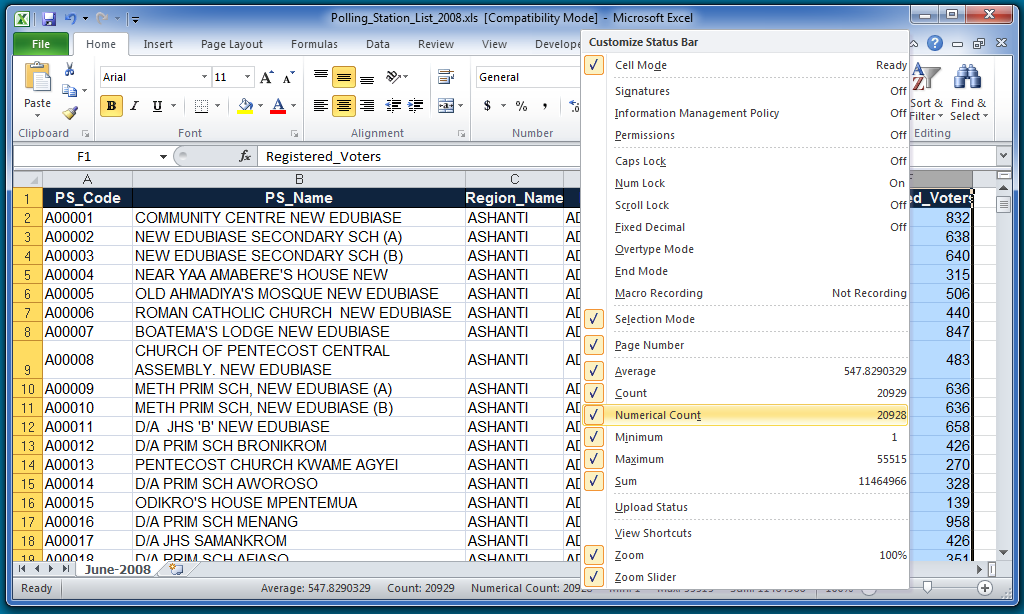
In this 2008 Polling Station List, you can see that the average number of registered voters for all of the polling stations is 547.8 voters. You can also see that the total number of cells filled in (i.e., the "Count") is 20,929. Excel can also show you that the minimum value for the highlighted cells is 1 and the maximum value is 55,515. Excel has an individual formula to calculate each of these values as well. You can create a new worksheet tab and put in the individual functions for average, minimum, maximum, count, and standard deviation. We did this for you with the heights data. Note that the standard deviation is not one of the options in that lower status bar, but you can enter the formula in another tab.
Or Use the Analysis Toolpak and Have Excel Calculate All of the Statistics
If you have the "Analysis Toolpak" installed[2], go to the Data tab where you should see "Data Analysis" listed on the far right.
From that menu, click on "Data Analysis," which will bring up a new window.
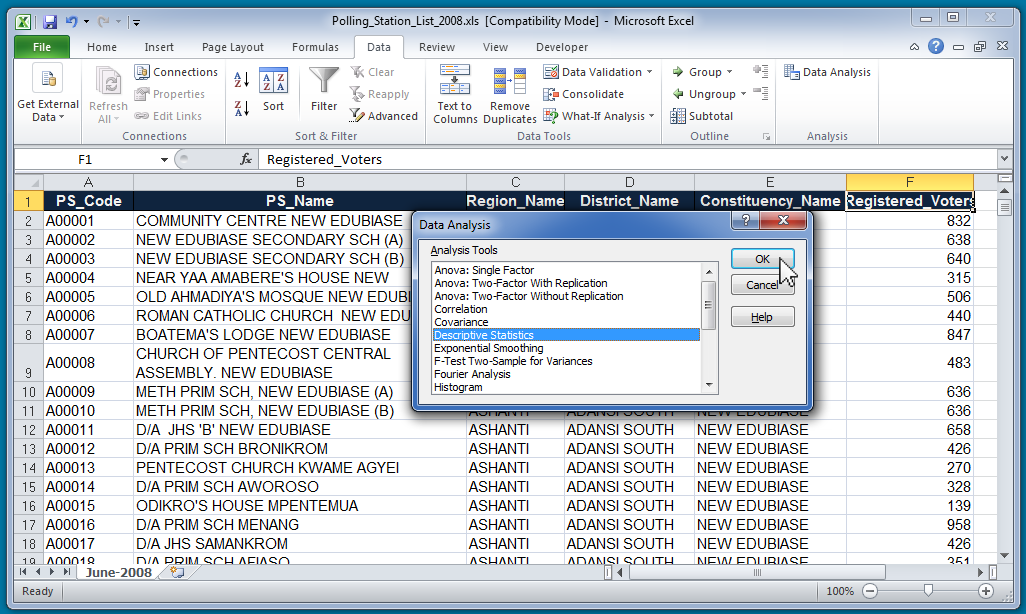
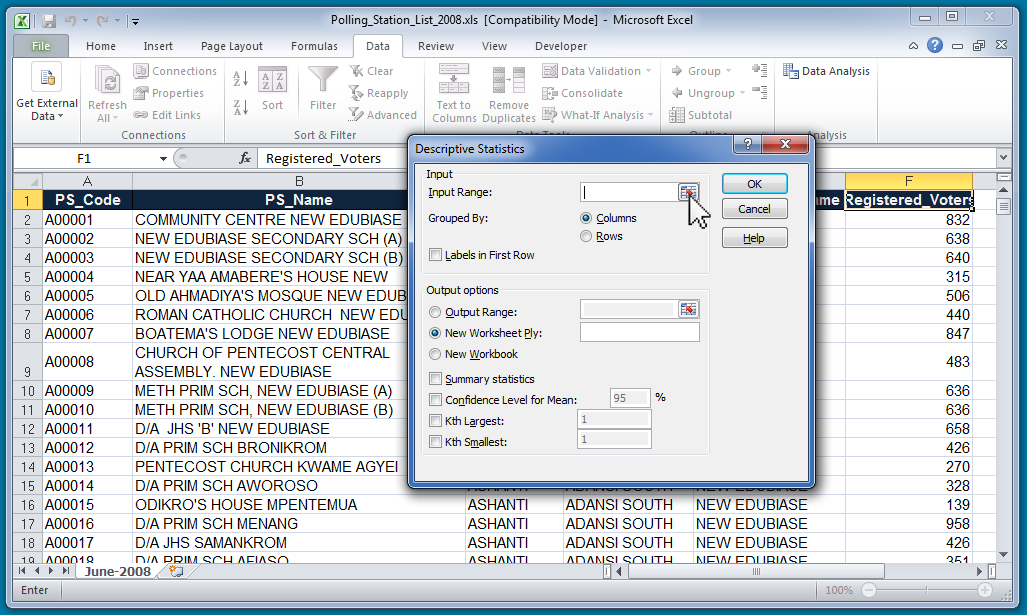
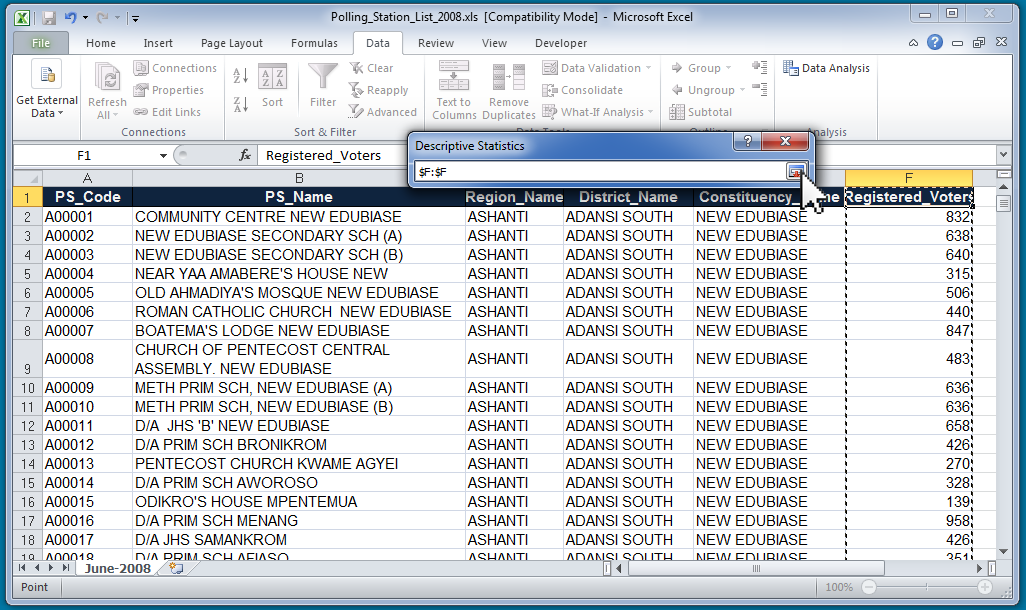
In the list under "Analysis Tools," choose "Descriptive Statistics" and then click "OK." It will bring up a new menu. In that new menu, click the box to the right of "Input Range:"
Now you will be able to select the range you want to describe. We are interested in the Registered Voters variable which is in column F. So, we select the top of column F to select the whole column.
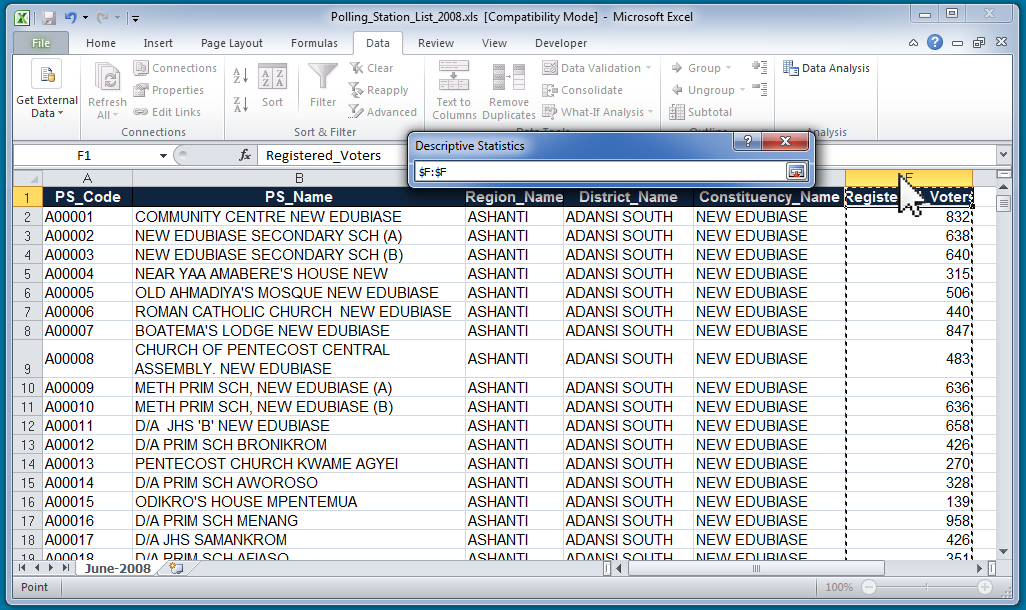
Then, click back on that box to the right of input ( ).
).
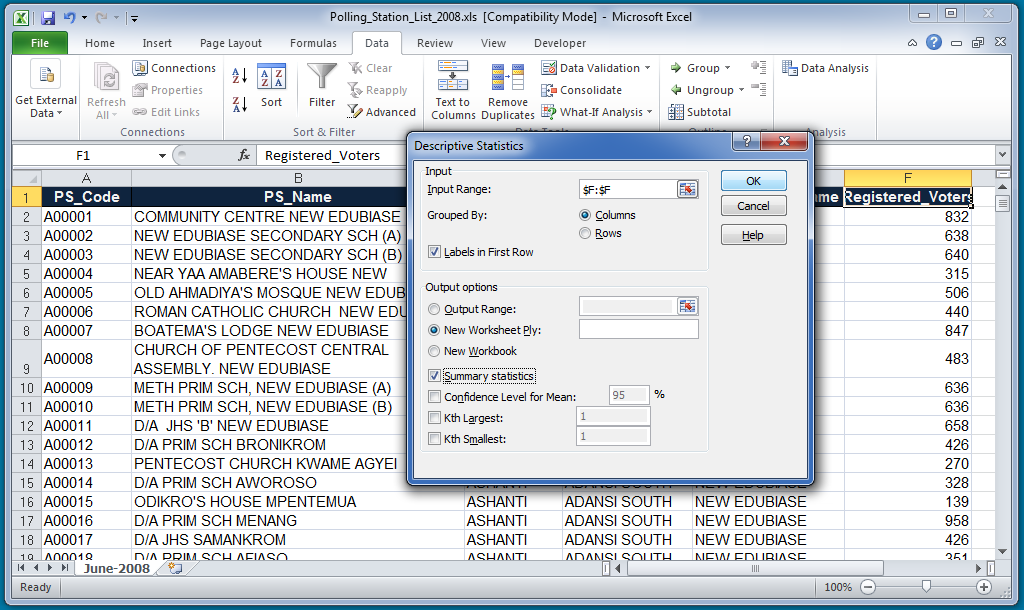
It will bring you back to the "Descriptive Statistics" window. In that window, make sure to click the checkbox next to "Labels in First Row" and click the checkbox next to "Summary Statistics." Also, make sure "New Worksheet Ply" is selected so that it puts your statistics in a new sheet. Then click "OK."
Now it will show you the new tab with all of the summary statistics for Registered Voters.
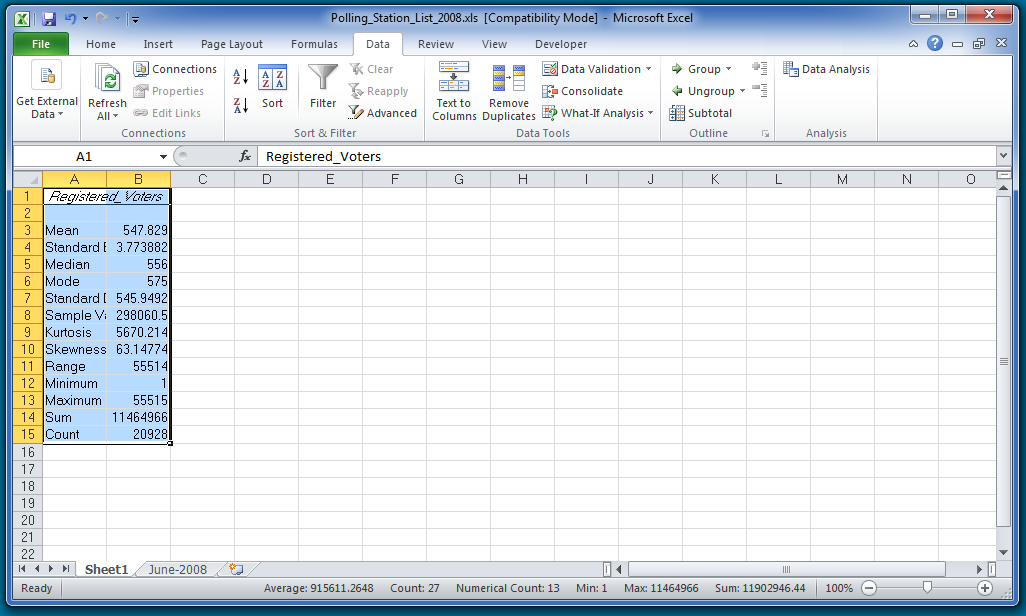
Given what you now know about the average, standard deviation and range, how would you describe the Registered Voter variable? Do you think the distribution is spread out a lot or do you think it is tightly clustered?
Compare the Actual Statistics to Expectations
Now that you have the summary statistics for the Registered Voters variable, how would you answer the below questions? How do the answers compare to your expectations from the beginning?
- Does it seem like anything is missing?
- Is the data structured in a way that makes sense?
- What is in each row?
- What is in each column?
The list is based on the 2008 list of polling stations for Ghana. Some of the information may have been modified and adjusted to highlight the concepts here. ↩︎
To install it, select the File tab, then choose "Options" near the end of the list on the left. In the new "Excel Options" window, select "Add-ins." "Analysis Toolpak" should be listed. Click to highlight it and then click "Go" at the bottom of that window. A new window will pop up called "Add-Ins." Under "Add-Ins Available", click the checkbox next to "Analysis Tookpak" and then click "OK." Now under the "Data" tab, you should have "Data Analysis" should appear as an option on the far right. ↩︎