7. Using Census Data to Strengthen Voter Registration Analysis
Module 7 will solidify skills you gained in Modules 5 and 6 to allow you to do more advanced analysis of voter registration data. We’ll also introduce new tricks that will help you cross-reference data from other helpful sources, like census data, to supplement your analysis of the voter registration. We hope that by the end of Module 7 you’ll be able to:
- Make use of Excel’s INDEX MATCH formula combination,
- Master your understanding of SUMIF functions,
- Master basic MS Excel operations, like percentages, and
- Explore political considerations of your data.
How Census Data Relates to Voter Registration?
As we mention in the Election Data Guide, and in Modules 5 and 6, a credible voter registration process fosters political equality and actively encourages the inclusion of eligible voters. When the voter registration process is fair and transparent, it can increase the legitimacy of an election. Alternatively, when the voter registration process is poorly executed or does not provide equal opportunities for participation, it can cast doubts on the legitimacy of an entire election. Civil society organizations often use voter registration statistics to help determine whether the overall process was fair and inclusive.
When available, census data complements voter registration data by providing insight on the eligible voting population. With census data, analysts can assess trends in registration rates and understand the degree to which different segments of a voting population are over- or underrepresented in the registry. Module 7 will strengthen your ability to cross reference complementary datasets of this nature and to contribute this important type of analysis.
Welcome Back to Opendya!
Election fun in Opendya continues! As you’ll recall, you were able to get ahold of a set of voter registration data compiled by the Election Commission. The file contains data on a five week voter registration update exercise organized ahead of the 2014 elections. This time, you were also able to obtain census data from the Statistics Agency on Opendya’s eligible voting population.
While not required, we suggest that you complete Module 5-6 first, so that you are familiar with the data set and political background of Opendya. If you haven’t completed Modules, here’s some important political background you should be familiar with:
- Opendya had national elections in 2010 and 2014.
- The capital of Opendya is in the Opa City district (District code: 47), which contains a mixture of urban and rural areas.
- Since the 2010 elections, violent conflict broke out in two districts: Conflicteri (District code: 9) and Disputana (District Code: 23).
- The census was conducted before violence broke out in the 2 districts.
- Ahead of the 2014 polls, the Election Commission of Opendya conducted a five-week voter registration update exercise.
Data Files
You’ll need two different files to complete this exercise:
- Opendya voter registration data (this includes the same raw data as Modules 5-6, but different column headers to be used for analysis); and
- Opendya census data
If you’ve completed Modules 5 and/or 6, you can continue to use your voter registration data file but will need to download the new census file. If you continue to use your existing file, you’ll need to add a few additional columns for analysis in Module 7 (mirroring the screenshots in the exercise), as your headers will not be pre-populated. You may also download a fresh data file with pre-populated column headers for analysis specific to this module.
Reviewing the Voter Registration Data
Let’s reacquaint ourselves with Opendya’s voter registration data. Click on the Registration_Data tab in the Registered Voters file.
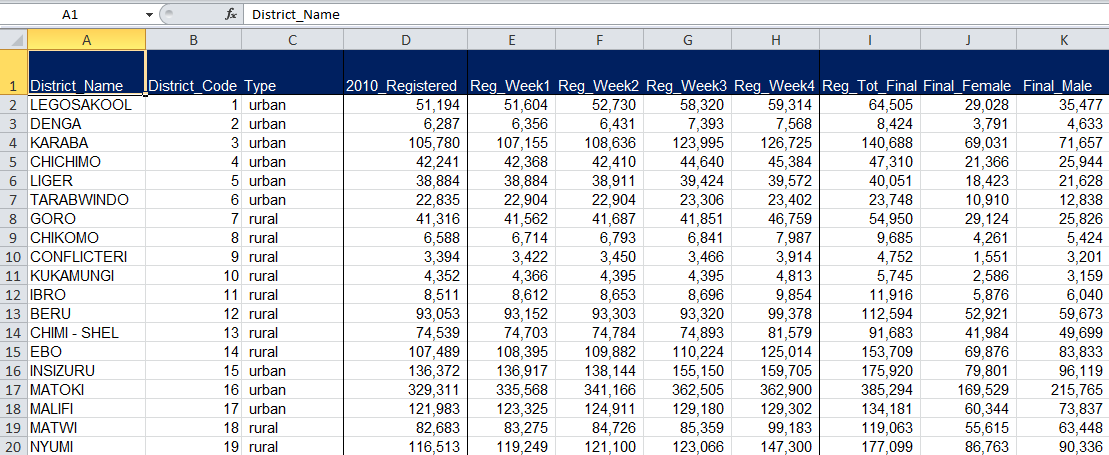
District_Name
The far left column of the Registration_Data tab contains the names of all districts in Opendya. Notice that this is the only geographic level provided in the dataset. At this stage, we have no further indication as to whether these districts are nearby one another or if they fall under the same geographic units at a higher level.
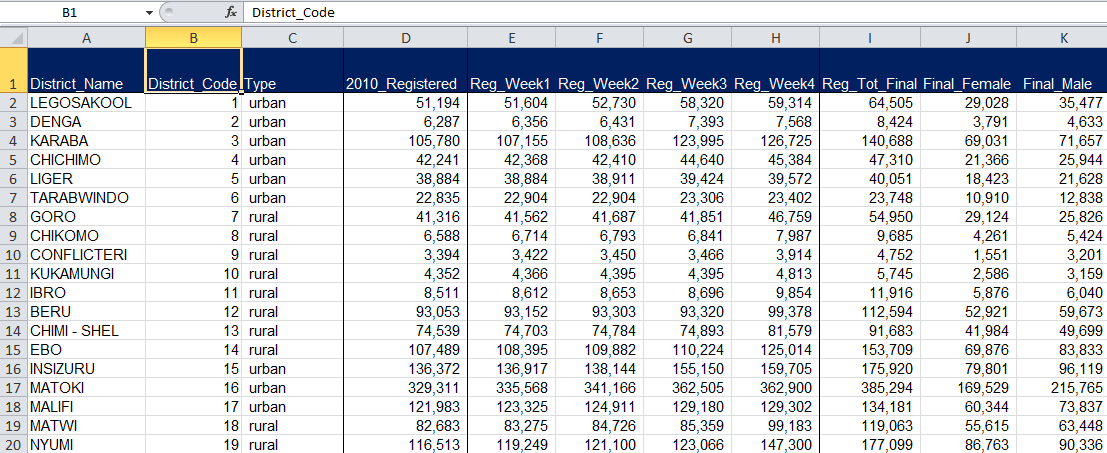
District_Code
The Election Commission of Opendya also assigns each district a unique code, or identifier. Take a quick second to scroll through the file and notice the pattern of how the districts are numbered.
As we mentioned in Module 2: Reviewing a Polling Station List, unique identifiers are extremely helpful when dealing with datasets. They help us catch duplicate entries and/or properly distinguish between units with similar names.
Type
The Type column indicates the characteristics of Opendya’s districts. Check through the data to review what descriptors are used to indicate the type of district. What different types do you see?
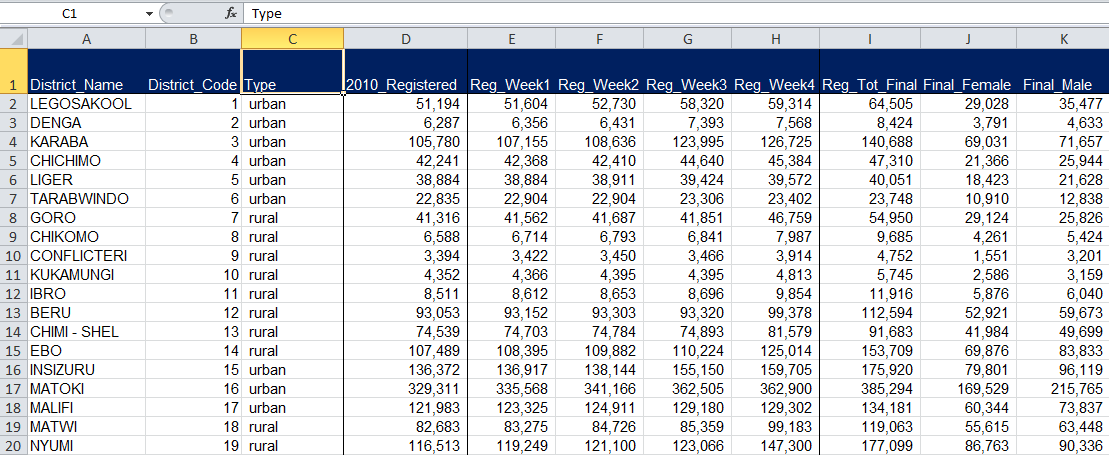
There are three types of districts in this dataset: urban, rural, and capital district.
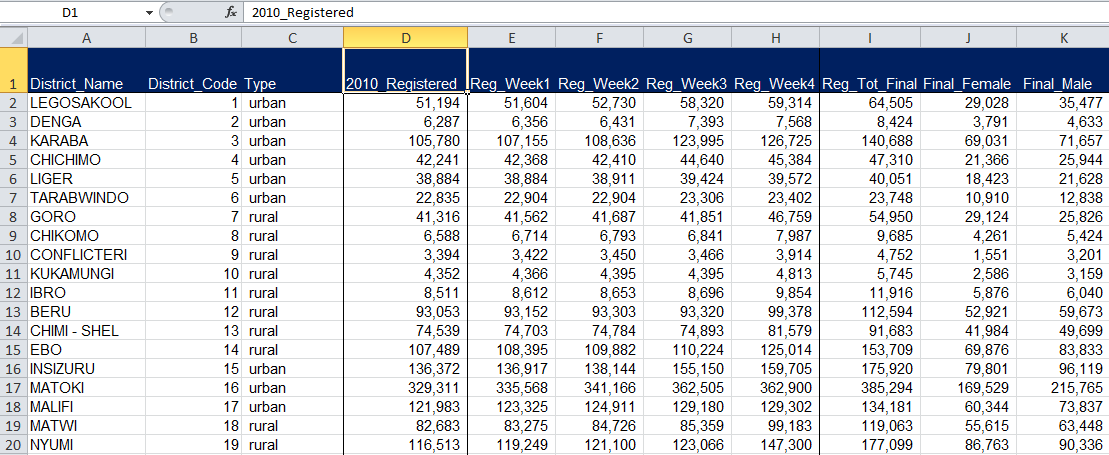
2010_Registered
We mentioned previously that Opendya had national elections in 2010. This data set contains the final number of registered voters when that election took place. We can use the 2010_Registered column to compare registration figures between election cycles. (Note that this column was primarily used for analysis in Modules 5 and 6, but we won’t need it in Module 7.)
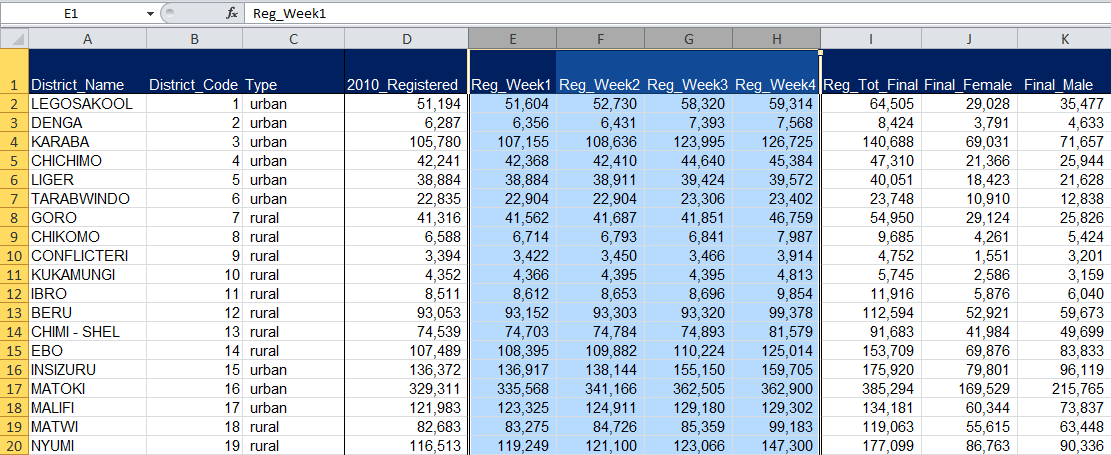
Reg_Week1, Reg_Week2, Reg_Week3, and Reg_Week4
We mentioned that Opendya’s Electoral Commission undertook a five-week voter registration update in 2014. The following four columns – Reg_Week1, Reg_Week2, Reg_Week3, and Reg_Week4 – provide us with the total number of registered voters at the end of four of the five weeks of the 2014 update exercise. The difference between each week gives us the number of new voters who registered during the exercise. (Note that these columns were primarily used for analysis in Module 6, we won’t need them in Module 7.)
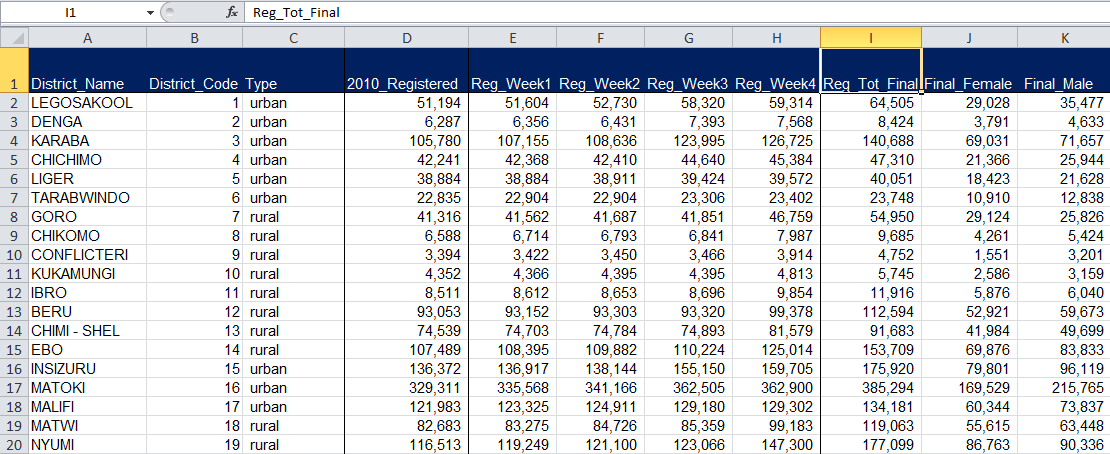
Reg_Tot_Final
The Reg_Tot_Final column provides the final total of registered voters per district following the entire five-week registration exercise in 2014.
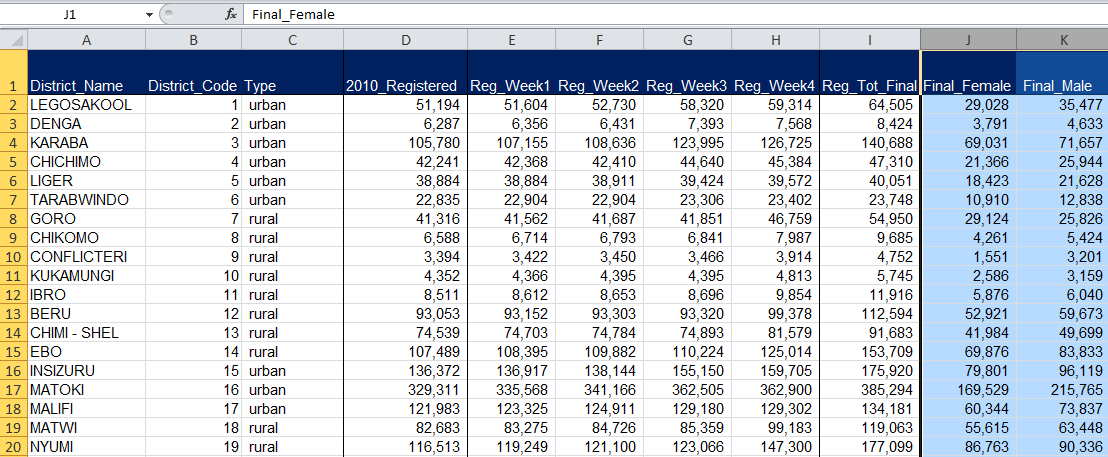
Final_Female, Final_Male
Columns J and K, respectively, tell us how many women and men are registered to vote in each district for the 2014 election.
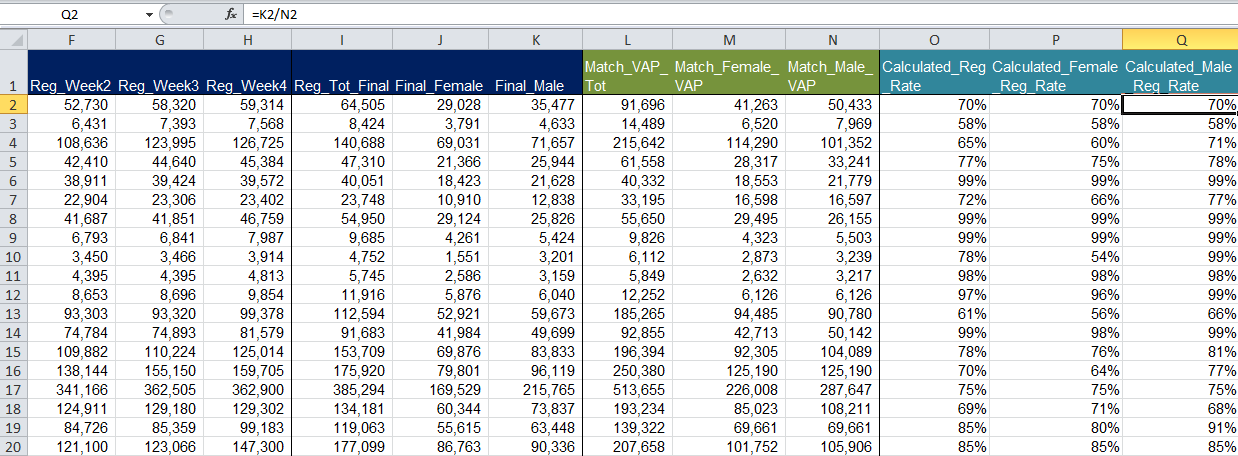
Columns L through Q
Columns L through Q in your Registration_Data tab will be used for Module 7 analysis. They will be explained in more depth once you begin your calculations.
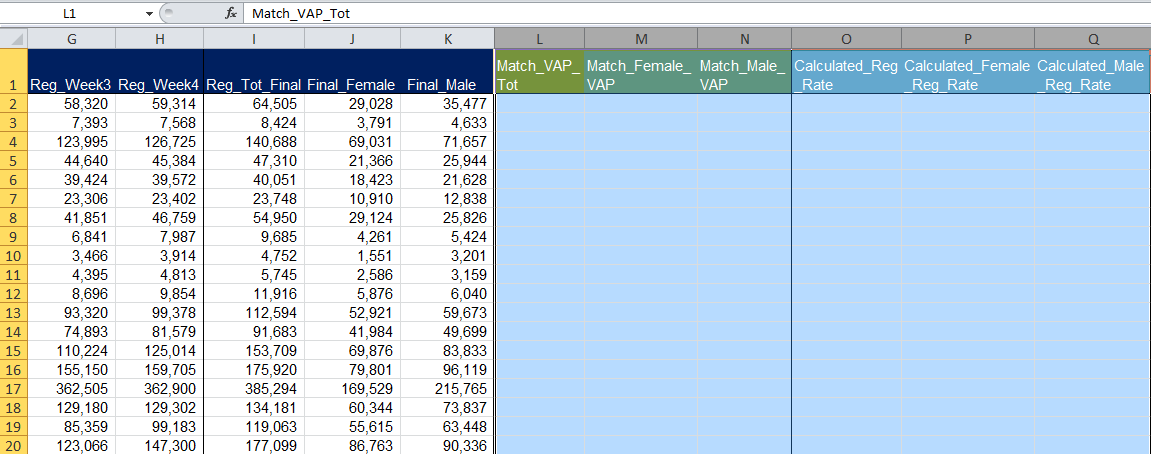
(Note: If you are using your voter registration data file from Modules 5-6, you will not have columns L-Q pre-populated as shown below. Take a moment and add the following column headers to your Registration_Data tab as show below: Match_VAP_Tot, Match_Female_VAP, Match_Male_VAP, Calculated_Reg_Rate, Calculated_Female_Reg_Rate, Calculated_Male_Reg_Rate.)
Data_Summary Tab
You’ll make additional calculations in the Data_Summary tab of your voter registration file (revised from Modules 5-6). We’ll explain these more in depth when it’s time for your analysis.
Reviewing the Census Data
District_Name, District_Code, Type
Like the voter registration data, the census data file contains the names of all districts in Opendya (District_Name, A), and the unique identifiers or codes for each district (District_Code, B). It also lists the type of district, namely whether a location is urban, rural or the capital (Type, C). These three columns overlap with data included in your voter registration file.
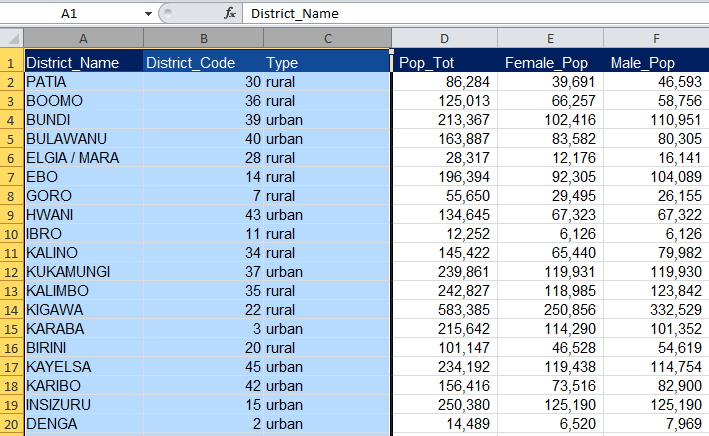
VAP_Tot
Column D of your census data file specifies the voting age population (VAP) in each of Opendya’s 47 districts.
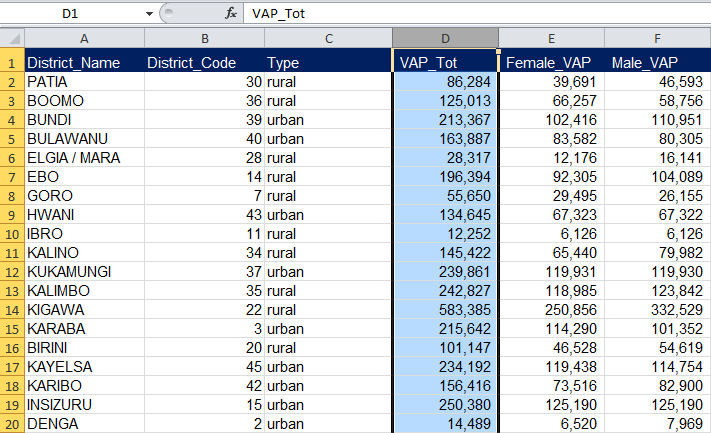
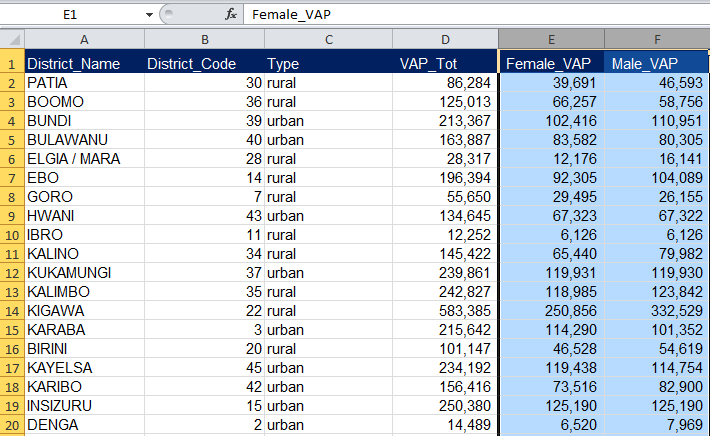
Female_VAP, Male_VAP
Columns E and F of your census data file specify the respective female and male voting age populations (VAP) in each of Opendya’s 47 districts. The sum of these two columns equals the VAP_Tot column.
Matching Census Data to Voter Registration Data
We have two useful, complementary data sets related to the number of registered voters in Opendya and the country’s voting age population. Combining our voter registration and census data into a single file will allow us to undertake more interesting analysis of registration rates and demographic registration trends in Opendya.
Remember that your census data file contains three columns (columns A-C) that overlap with the registration data file and three columns that offer brand new information related to Opendya’s voting age population (columns D-F). Carefully adding, or “matching,” census data to our voter registration data file (columns L-N) is our first major task! To do so, we need to make sure that the voting age population data for each district in Opendya slots into the correct district rows of our voter registration datasheet. We’ll automate this task by employing an Excel formula combination known as INDEX MATCH. This formula is a bit tricky, but extremely useful in election data cleaning and analysis. Stick with us!
An Overview of INDEX MATCH
The INDEX MATCH formula combines two different Excel formulas: INDEX and MATCH.
INDEX Formula
The INDEX formula returns a value or the reference to a value (i.e., cell number) from within a table or range. In other words, you specify a range of cells you’re searching within, as well as a row and/or column number. Excel then looks up and gives you the value of the specific cell you’ve specified.
The formula syntax is structured like this: INDEX(array, row_num, [column_num])
- Array (Required):An array is just a range of cells within which you’re searching for data.
- If the array contains only one row or column, the corresponding Row_num or Column_num argument is optional.
- Row_num (Required):Selects the row in the array from which to return a value. If Row_num is omitted, Column_num is required.
- Column_num (Optional): Selects the column in array from which to return a value. If Column_num is omitted, Row_num is required.
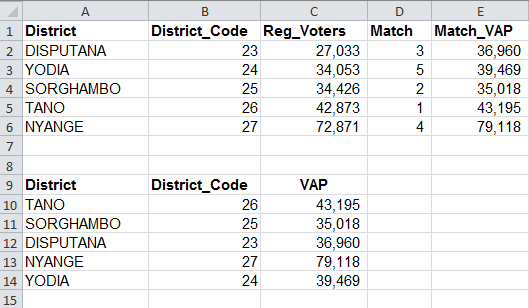
Here’s a quick example of how INDEX will be used in this exercise. Say you have a short list of several districts in Opendya and their corresponding registered voter figures.
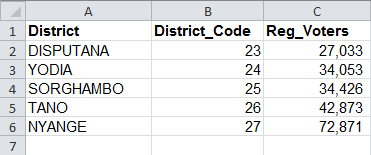
In a separate cell, you want Excel to lookup, or return, the number of registered voters in Yodia. This information is in cell C3. You can use INDEX for this.
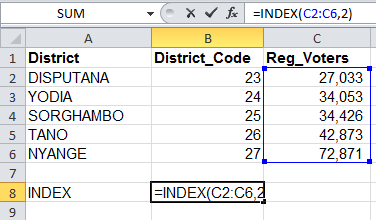
In the above formula, cell “C2:C5” serve as the array (highlighted in the blue square). The array is just the range or group of cells we want Excel to search through. Then to ensure that Excel returns the number of registered voters in Yodia, we list “2” as the row_num, or row number. Although data for Yodia district is in row 3 of the Excel sheet, it technically falls into row 2 of our array since we omitted row 1 (column headings) from our range, or array.
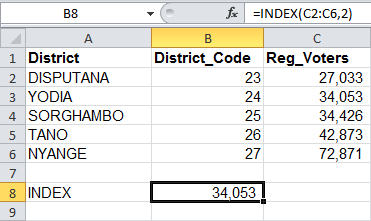
When we hit Enter, the INDEX formula has looked up and returned the number of registered voters in Yodia just like we wanted!
MATCH Formula
Now let’s review the MATCH formula. The MATCH function searches for a specific item you’re looking for within a range of cells, and then gives you the position, or row number, of that item. Here’s how the formula is structured:
MATCH(lookup_value, lookup_array, [match_type])
- Lookup_value (Required): This is the value that you want to Excel find a match for in a specific range, or lookup_array.
- Lookup_array (Required):Your lookup_array is the range of cells that you’re asking Excel to search within. For the MATCH formula, your range must be a continuous row or column, rather than a table. MATCH only can only specify either the vertical or horizontal position for a value (not both at the same time).
- Match_type (Optional): The match_type tells Excel what kind of match you’re looking for, or the level of specificity to look for. Match_type is defined by the numbers -1, 0, or 1. The default value for this argument is 1 if you specify nothing. Here’s what the different values mean:
- 1 = MATCH finds the largest value that is less than or equal to your lookup_value
- 0 = MATCH returns only a value equal to your lookup_value
- -1 = MATCH finds the smallest value that is greater than or equal to your lookup value
Let’s think back to our Opendya example to understand how MATCH works. In addition to our mini voter registration spreadsheet shown in the INDEX example, say we have a separate table that contains census data on Opendya’s voting age population (VAP). Notice that districts are not in the same order across tables.
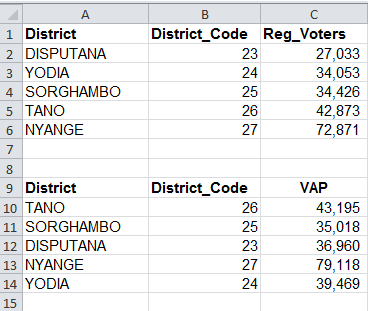
The MATCH formula will tell us the position, or row number, each district of Opendya is in organized in in the complementary census data.
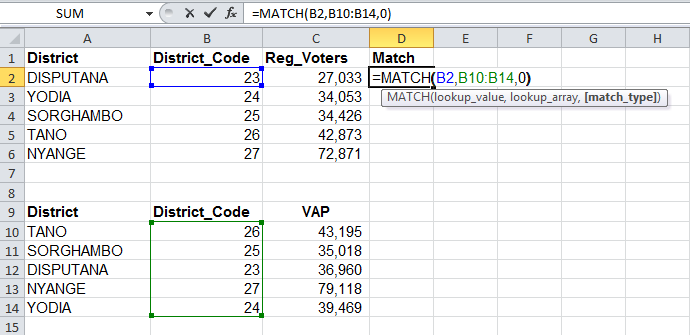
In the above formula:
- We’ve specified cell B2, District_Code = 23, as our lookup_value
- Cells “B10:B14” of our census data table serve as our lookup_array , or range;
- Last, we’ve selected “0” as our match_type, which means we only want an exact match of our lookup_value, “23.”
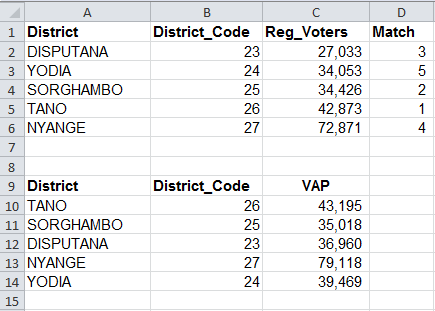
Here we have it! In our “Match” column, Excel has told us what rows the Opendya’s districts are located in within the census table. Remember that we omitted all of row 9 (column headings) from our lookup_array, or range, so the MATCH value comes to one less than the row number of each district in the census file.
Combining INDEX and MATCH
Now that you understand what INDEX and MATCH do separately, let’s see what the two formulas can do when combined.
Say you’d like to automatically bring voting age population (VAP) data from your census file to your voter registration file. The INDEX MATCH combination can do this!
Remember that the INDEX formula is able to return values (the actual content of a cell) when the user selects an array or range, a row number, and/or a column number. Formula =INDEX(array, row_num, [column_num]). However when working with the full datasets for Opendya’s voter registration and census – you won’t always automatically know the row number in which the value you’re looking for appears. That’s where MATCH comes in!
Remember, the MATCH function returns the position (row or column number) of the value you’re specifically looking for within a range of cells (a single column or row). Formula = MATCH(lookup_value, lookup_array, [match_type]). You can use the MATCH formula to serve as the row_num component of your INDEX formula. That means that Excel automatically looks up the row number you need to use in order to return your INDEX value. Here’s how this works in practice.
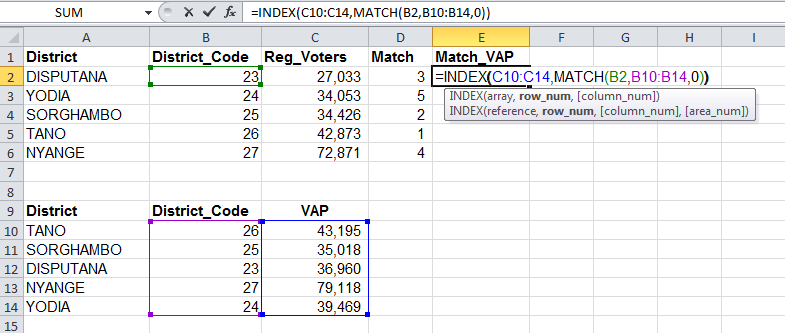
In the above example, we’re asking Excel to automatically give us the voting age population (VAP) of Opendya’s districts, pulling data from the census table to the voter registration table. Here’s how the formula breaks down.
INDEX
- Because we eventually want voting age population (VAP) data to be entered into cell E2, we know our desired return value lies within cells C10:C14 for Disputana’s VAP. That range will serve as our formula’s array.
- The MATCH formula will serve as the row_num argument of our INDEX formula. In this case, MATCH tells us which row the value of cell B2 (District Code = 23) falls within in our range. Since District, District_Codes, and their corresponding VAPs fall within the same row of our table, we know that the row number for “District Code 23” corresponds with the row number of its VAP.
MATCH
- Cell B2, Disputana’s district code of 23, will serve as the lookup_value in our MATCH function. That’s the value Excel search for and whose row number the MATCH function will give us.
- Our lookup_array, or range, is B10:B14, since that is where all district codes are specified within our census data.
- Our match_type is “0,” meaning we are looking for an exact match for cell B2, “23” within our range B10:B14.
When we hit Enter, our INDEX MATCH formula automatically gives us the VAP of Disputana, district code 23! If we replicate the same formula logic across other districts, we can pull their VAPs from the census data table as well. Here’s a copy of our worksheet once we’ve matched over all VAP data from one table to another.
And that’s how INDEX MATCH works! We hope you now have a basic understanding of the logic behind the formulas.
Why use INDEX MATCH over other methods?
At this point you may be wondering why we used this complex Excel formula combination, INDEX MATCH, when you could have either manually copy-pasted the voting age population data, or sorted and then copy-pasted the data. Here’s why!
One of the main reasons we automate the data matching process in this manner is to avoid human error. Avoiding errors is critical when working with sensitive election data and ensures that your analysis is of sound quality. Manually copying and pasting data is highly prone to human error (especially when working with large data sets) and is inadvisable in most circumstances. Sorting data is similarly prone to human error, and in many cases won’t help you meet your goal. For example, the number of rows or the organization of sorted datasets you are trying to match up may not be exactly the same, which makes a simple copy-paste impossible (or highly tricky!). Lastly, we often work with election data that contains thousands, or even tens of thousands, of rows. Manually copying and pasting data would not only be prone to errors, it would take many hours of mindless work. So taking just a minute or two to set up an INDEX MATCH formula can save you many hours of work! And the more often you use INDEX MATCH, the faster you’ll get at setting up the formula.
INDEX MATCH, though complex, is thus one of the most accurate and efficient ways to match or lookup data across sources.
Matching the Census Data
Now it’s time to put your new knowledge to the test! In this portion of the module, you’ll utilize the INDEX MATCH formula three different times to match data from the census data file to the voter registration data file – thus creating a master file for analysis.
Make sure to have both your voter registration and census data files open, and we’ll get started
Matching VAP_Tot
In your first application of INDEX MATCH, we’d like you to accurately match data on the voting age populations for each of Opendya’s districts in your census data file (column D, VAP_Tot) to the empty Match_VAP_Tot column (L) in your voter registration data file. (Note that if you did not download a fresh voter registration data file, you will need to create a new column for Match_VAP_Tot and for all of the remaining calculations to come.)
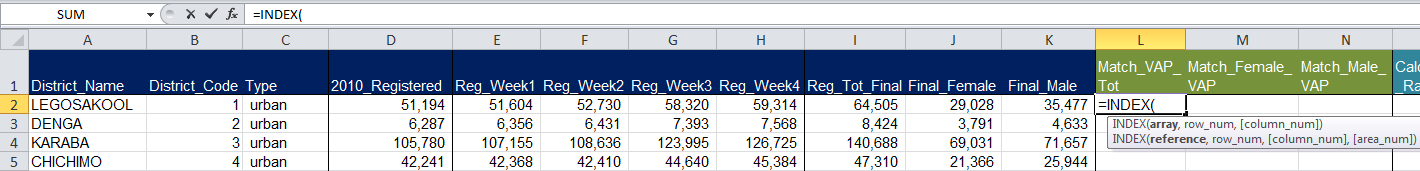
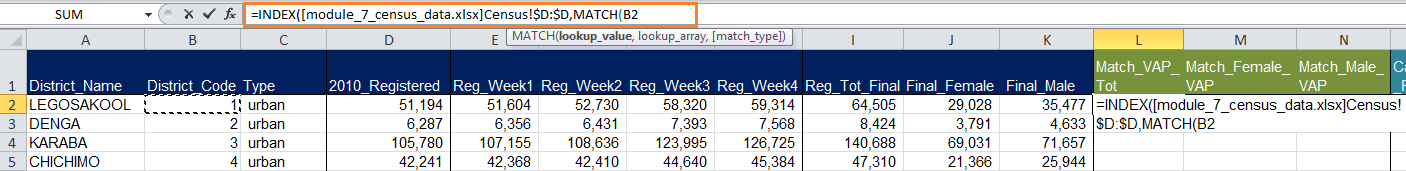
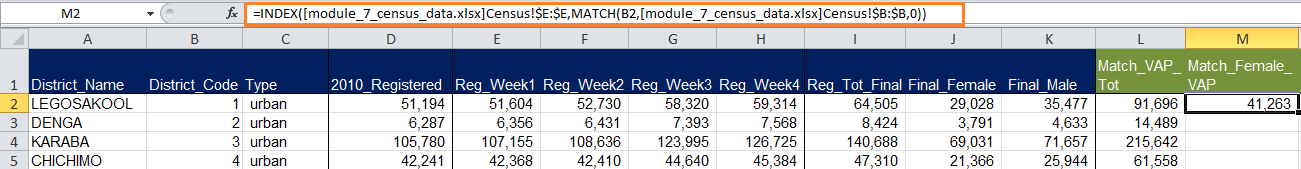
We’ll begin our formula in cell L2 of our voter registration file. In this file, row 2 contains data pertaining to the Legosakool district. Again, our goal in employing INDEX MATCH here is to automatically pull Legosakool’s total voting age population (VAP_Tot) from our census data file into our voter registration file.
1. In cell L2 of your voter registration file, type =INDEX(. As with other formulas, Excel tips you off about which specifications, or arguments, are required for this function to work.
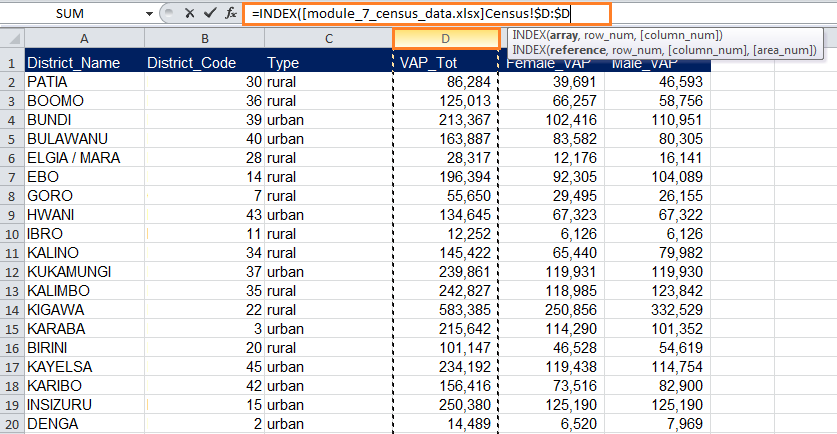
2. You now need to select your array. Remember in an INDEX formula, your array is the group of cells within which your desired value lies. In other words, the array tells Excel where to search for your value. Since you are specifically trying to find the voting age population for Legosakool, your array is column D (VAP_Tot) of your census data file.
Leaving your INDEX formula open in the voter registration file, click over to your census data file and select all of column D by clicking the column label lettered “D.” Notice that Excel autopopulates your formula according to where you’ve clicked, including an indication that you’ve selected an array from another source file.
Don’t hit Enter yet!
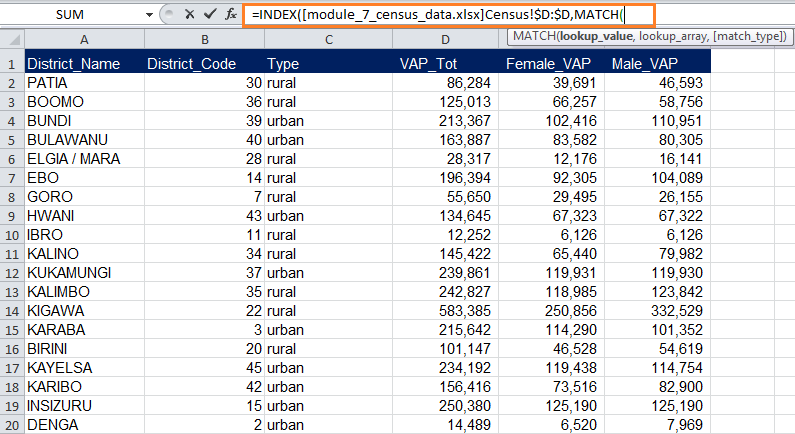
3. Type a comma , and write MATCH(. It’s OK to keep your census file open here. So long as you do not yet hit Enter, Excel knows you’re still working on a formula that originates with your voter registration file.
You’re now at the stage where you need to nest a MATCH formula within your INDEX formula. As we mentioned previously, MATCH will fulfill the INDEX formula’s row_num requirement.
4. Leaving your formula open, click back to your voter registration data file. Click on cell B2, “1.” The contents of cell B2, the district code for Legosakool, will serve as the lookup_value in your MATCH formula.
We’ve selected a District_Code instead of a District_Name as our lookup_value as it is intended to serve as a unique identifier. Your census and voter registration files contain columns for both District_Code and District_Name, but matching datasets according to name is more prone to error due to misspellings, different spellings, or duplicate names.
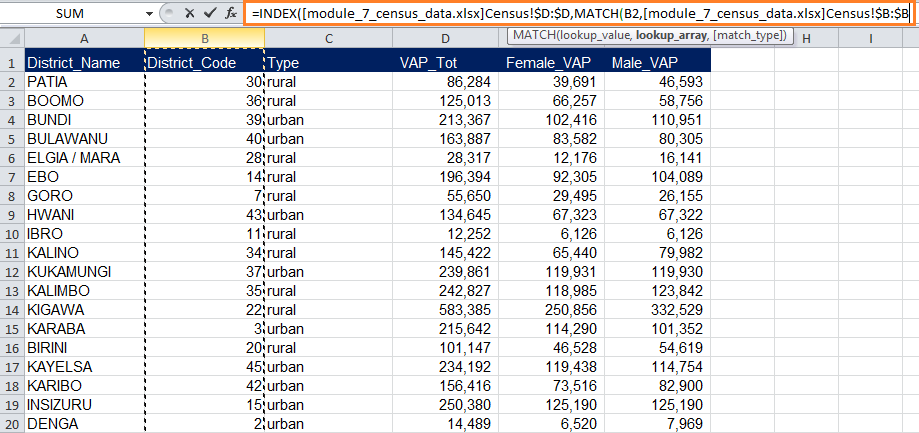
Type a comma ,. You now need to specify your lookup_array. You’ve already asked Excel to find a match for the District_Code value of “1,” which corresponds to the Legosakool district. Next, you need to tell Excel where to look in order to return the correct row number.
Click back to your census data file and select all of column B, District_Code. Here, you’ve asked Excel to check what row in your census file the data for Legosakool is stored (marked by a District_Code value of 1).
Once Excel finds what row Legosakool’s data appears in your census file, the row number returned by the MATCH formula will become the row_num criteria of your INDEX formula. Remember, your overall goal is to accurately copy over the census file’s voting age population data for Legosakool into your voter registration file. If you’ve successfully used MATCH, Excel now knows what row number within column D, VAP_Tot Legosakool’s voting age population data is stored in.
6. Type another comma ,, and then type 0. This tells Excel that you’re looking for an exact match for the District_Code value of “1” within column B of your census data file.
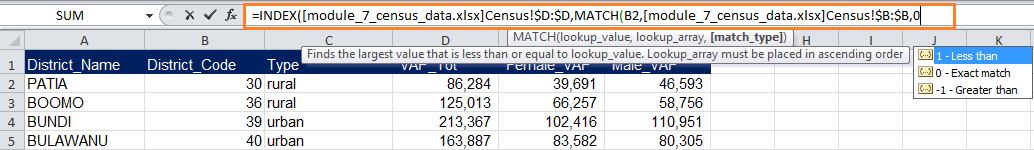
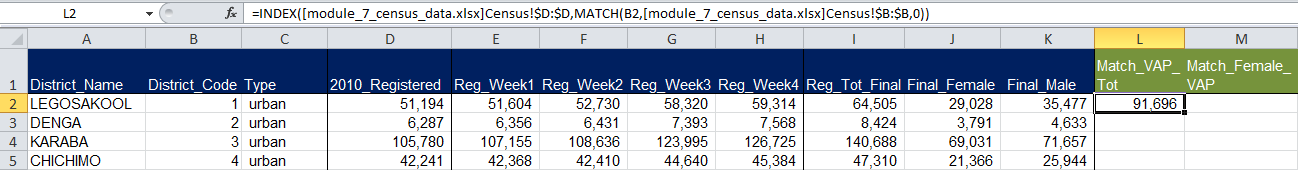
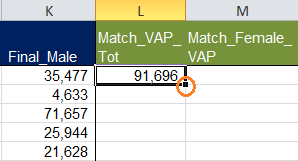
7. Enter two closed parentheses )), since you’ve entered two formulas in total, and hit Enter. What value did Excel return for the voting age population of Legosakool?
If you got 91,696 voters, you’ve successfully completed your first INDEX MATCH!
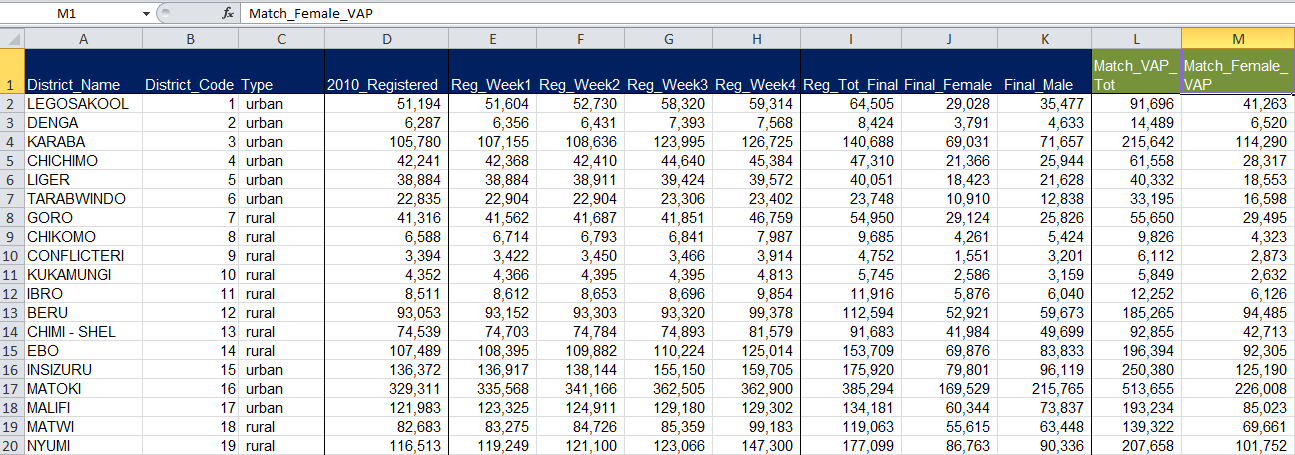
8. Now you’ll need to replicate this formula combination in order to pull voting age population data for all remaining districts of Opendya. Don’t worry, you won’t need to INDEX MATCH 46 more times! Simply click the small square in the lower right hand corner of cell L2.
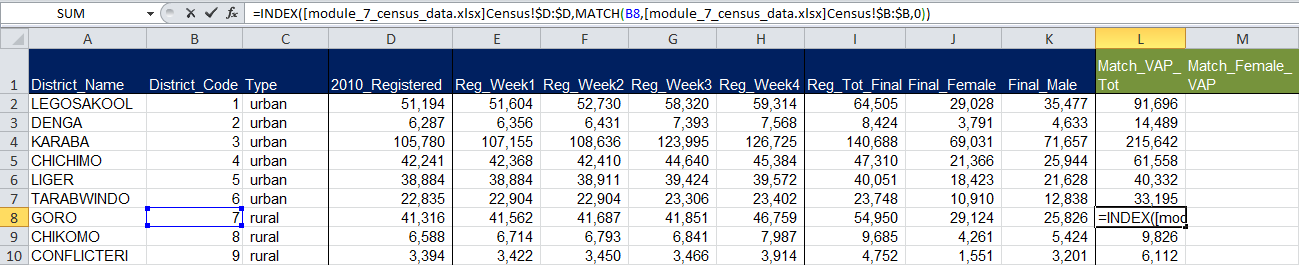
Excel should auto-populate your calculations in the remaining rows of column L, keeping all formula specifications constant except for the lookup_value in your MATCH formula. Excel anticipated that you wanted your lookup_values to vary across to rows. Click on a random cell within column L, Match_VAP_Tot, to make sure Excel did what you needed it to.
For example, the below image highlights the Match_VAP_Tot return for Goro district. You’ll notice that Excel automatically changed the MATCH lookup_value to the District_Code for Goro district. That ensures that the voting age population data returned uniquely corresponded to Goro district (District_Code = 7), as opposed to another district in Opendya.
Matching Female_VAP
We hope you’re up for a second INDEX MATCH! This time, we’re looking to populate column M, Match_Female_VAP, with the female voting age population data for each district of Opendya.
We’ll apply very similar logic to this formula as we did with Match_VAP_Tot. Take a moment to think through how you might match this data from your census file to your voter registration file. Think about which columns will you need to reference and/or pull data from?
1. In cell M2 of your voter registration file, type =INDEX(.
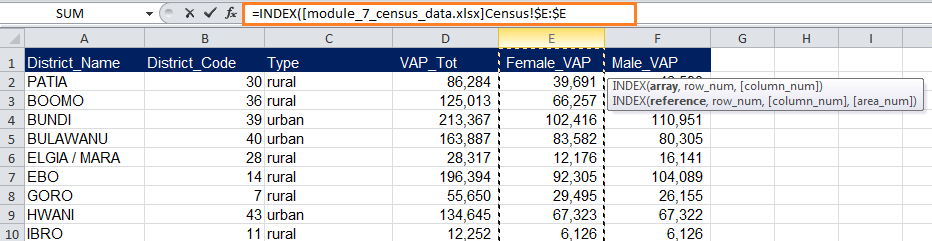
2. Now select your INDEX array, which is the range of data you would like Excel to return in cell M2. In this case, you are interested in Legosakool’s female voting age population data housed in column E, Female_VAP, of your census data file. Click over to your census data and select all of column E.
3. Type a comma , and then MATCH(. You’ll again use the MATCH formula to locate the row that contains Legosakool’s data in your census file. The results of your MATCH formula will serve as the row_num criteria in your INDEX formula. This MATCH will look exactly the same as your previous calculation for Match_VAP_Tot.
4. With your formula open, click back to your voter registration data file. Click on cell B2, “1.” The contents of cell B2, the district code for Legosakool, will again serve as the lookup_value in your MATCH formula.
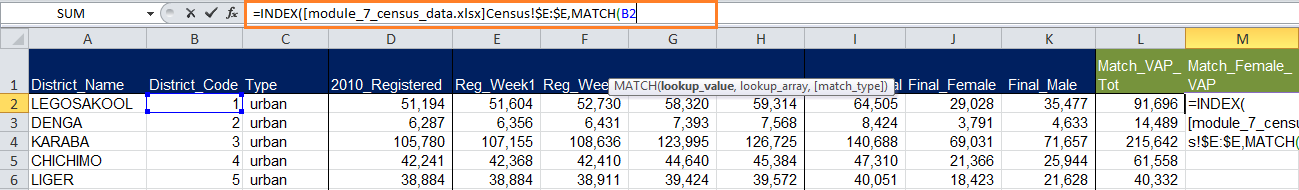
5. Type a comma , and specify your lookup_array. You’ve already asked Excel to find a match for the District_Code value of 1, which corresponds to Legosakool. You now need to tell Excel where to look for district codes in order to give you the correct row number.
Click back to your census data file and select all of column B, District_Code. Here, you’ve asked Excel to check what row in your census file the data for Legosakool is stored (marked by a District_Code value of 1).
6. Type another comma , and then type 0 to specify that you’d like an exact match for the District_Code value of “1” within column B of your census data file.
7.Type two closed parentheses )), and hit Enter. What value did Excel return for the female voting age population of Legosakool?
8. Now replicate your INDEX MATCH formulas across all remaining districts of Opendya. (Hint: Double click the bottom right corner in cell M2.)
Now double check a few of your responses to make sure you were on the right track!
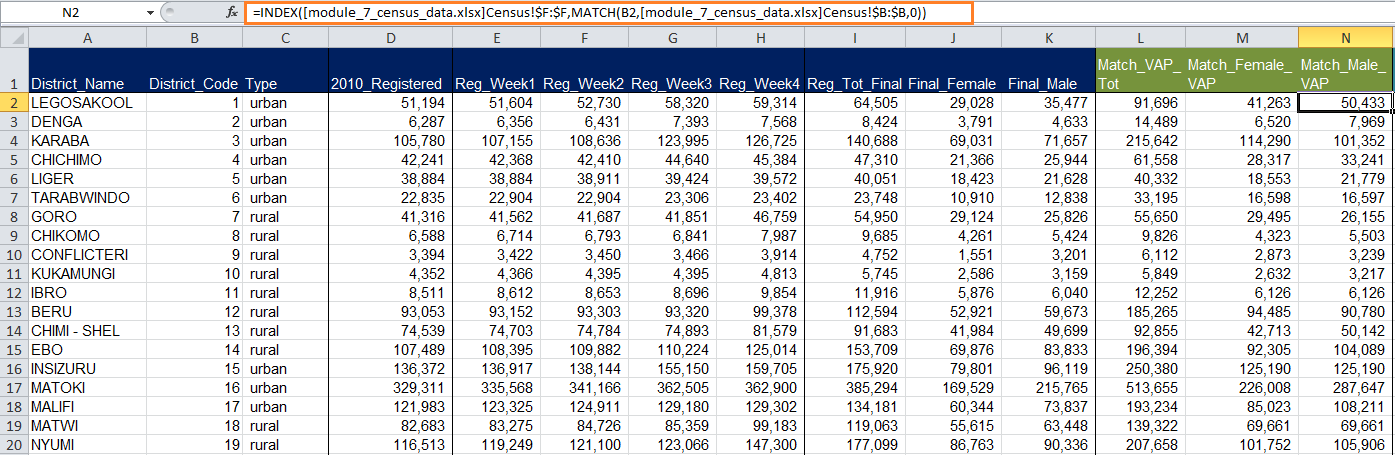
Matching Male_VAP
Last but not least, we’d like you to match the census data on Opendya’s male voting age population to the voter registration data file. You’ll use column N, Match_Male_VAP to make this happen. Before getting started, think about how this formula might differ from your two prior uses of INDEX MATCH? What arguments or criteria might you need to change in order to match this data correctly? What stays the same?
We’d like you to try this INDEX MATCH function without much instruction. If you need help, click back to the previous matching exercises for Match_VAP_Tot and Match_Female_VAP. As a helpful hint, Step 2 where you select your INDEX array is the only point at which your formulas should differ across columns L-N.
See, INDEX MATCH is easier than you expected! Check your responses below.
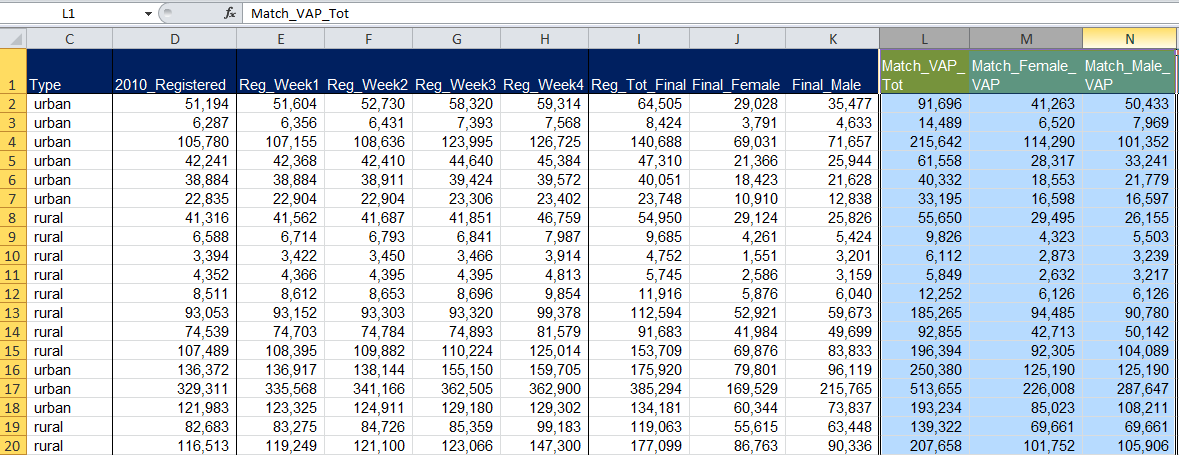
Pasting Matched Data As Values
You’ve successfully pulled corresponding data from your census file to your voter registration file! However, you’ll notice the data populating columns L-N in your registration data file are not numbers or values, they actually remain formula references pulling data from other sources. While you can still complete calculations using this data, you risk losing all of the VAP figures you just matched over if you delete or lose the original census data file. The links in your INDEX MATCH formulas will break. You also will not be able to properly email your dataset to another person, as their file will include reference errors in Columns L-N, because the data is being pull from the separate census data file.
To prevent this from happening, consider copying all of columns L-N and pasting the data back “as values.” Here’s how this is done.
1. Select all of columns L-N by clicking the letter “L” at the top of the column and, while still holding down, dragging your cursor across to column “N.”
2. Type “Ctrl+C” which is the shortcut for copying. You could also Right Click and select “Copy.”
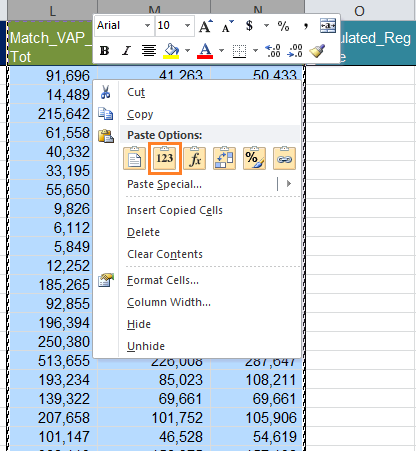
3. Once your data has been copied, Right Click. Under “Paste Options” select the “Paste As Values” option pictured below (with the “123” symbol).
Now, click on a couple of cells within columns L-N and notice that the formula bar now displays those cells as numbers rather than as formulas.

Tip: To be extra safe, before pasting your data as values, save a copy of your tab with the INDEX MATCH formula references in case you accidentally make a mistake during the paste as values process and need to retrace your steps. You can do this by right clicking on your tab labeled “Registration Data” at the bottom of your Excel window, selecting “Move or Copy,” and checking the “Create a Copy” box.
Calculating District-By-District Registration Rates
Thanks to your expert INDEX MATCH skills, we now have a consolidated file with Opendya’s voting age population and registered voters data across all districts. The combination of census data and voter registration data allows us to calculate the percentage of eligible voters included in Opendya’s voter registry after the 2014 update exercise.
Calculated_Reg_Rate
We’re going to use division in Excel to calculate the 2014 rate of registered voters for each district in Opendya. We’ll do this in column O of your voter registration file, titled Calculated_Reg_Rate, of your voter registration file. (Note: If you did not download a fresh voter registration data file at the start of Module 7 and are instead using your files from Modules 5-6, you will need to create a new column for Calculated_Reg_Rate and for all remaining analysis needs.)
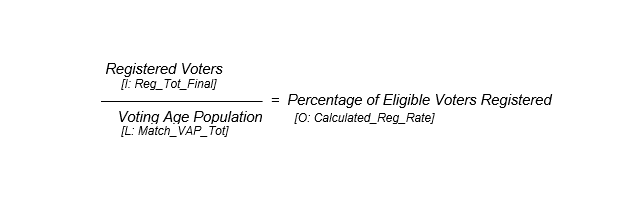
To calculate the per-district registration rates, we need to divide the figures in I, Reg_Tot_Final, by the figures in column L, Match_VAP_Tot.
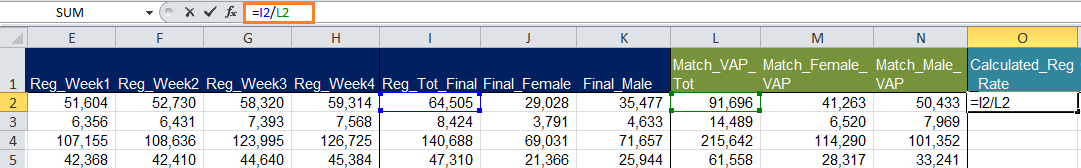
1. In cell O2, type an equals sign =. Then click on cell I2. You’ll notice that Excel automatically adds the term “I2” to your formula once you click on that cell. Alternatively, you could simply type in the term “I2” and Excel will automatically link to that cell.
2. Now type a forward slash / and click on cell L2, the voting age population in Legosakool.
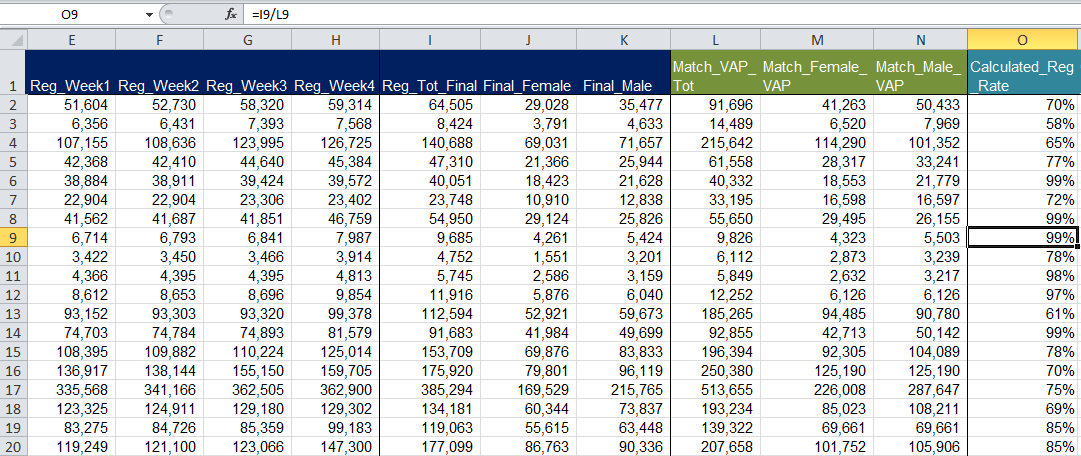
3. Hit Enter! What is the registration rate in Legosakool?
4. Now replicate your division formula across all remaining districts of Opendya. (Hint: Double click the square in the bottom right corner of cell O2. To be safe, click through a few cells in column O to make sure that Excel correctly replicated your division calculation across the other districts.) Check your answers below!
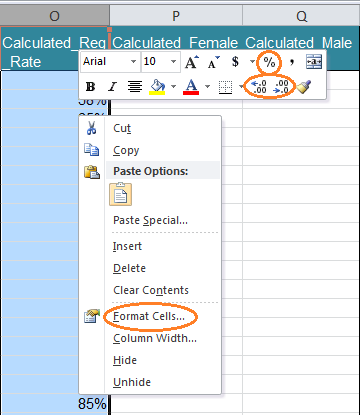
Note that your cells may not automatically populate as percentages, but rather as decimals or as 0s and 1s. If this is the case, click the top of column O to select the entire column. Right click and select the “%” symbol. Alternatively, right click, select “Format Cells,” and then select “Percentage” from the left-hand menu of the pop-up box.
Calculated_Female_Reg_Rate
Now we’d like you to calculate the registration rate among eligible female voters across each of Opendya’s districts. Another quick division formula should do the trick! Let’s use column P, Calculated_Female_Reg_Rate.
Before we walk you through this, what columns do you think you’ll need to use in order to calculate female registration rates?
Here’s your mathematical logic for this analysis:
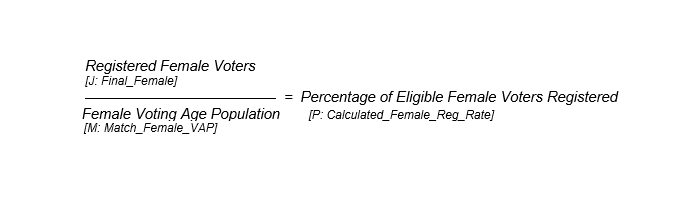
1. Begin your division calculation with an equals sign =. Then click on cell J2, the final number of registered female voters in Legosakool.
2. Type a forward slash / and click on cell M2, the eligible female voting population in Legosakool.
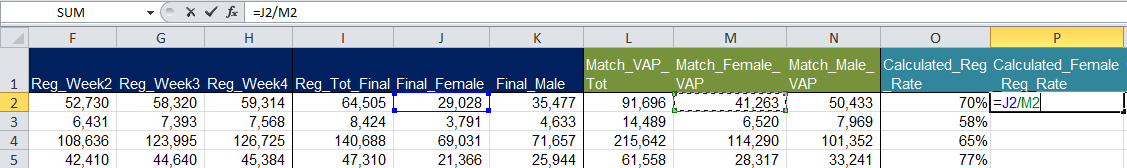
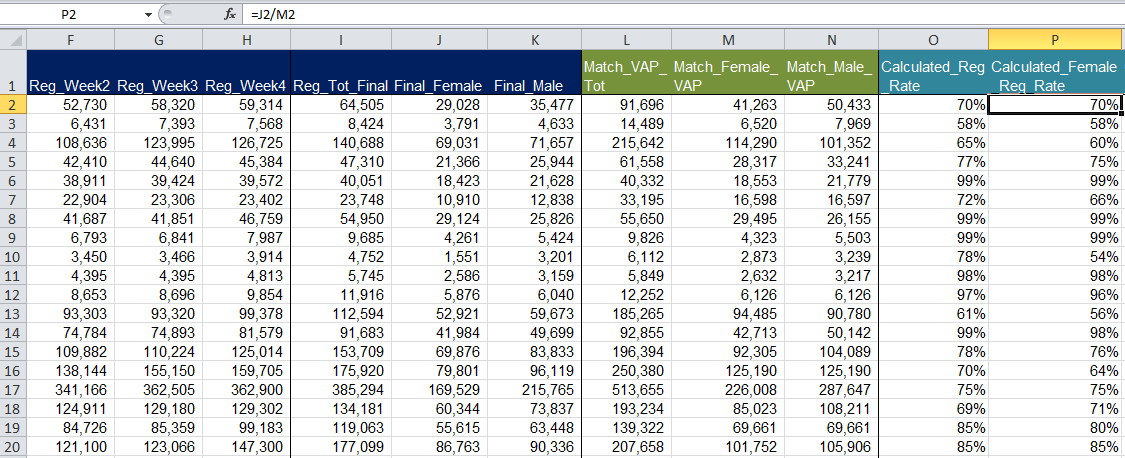
3. Hit Enter. What percentage of eligible women registered to vote in Legosakool? We hope you calculated a female registration rate of 70%!
4. Now replicate your calculation across all remaining districts of Opendya. Crosscheck a few of your answers below to make sure things match up.
Calculated_Male_Reg_Rate
Now on your own, calculate the percentage of eligible male voters that are registered across the different districts. If you need assistance, refer back to the previous registration rate calculations.
Check your calculations below!
What do you see?
Now that we’ve calculated total, female, and male voter registration rates across districts, take a moment to scan through the data. Think back to the political context you were given at the beginning of this module.
- What districts stand out to you as having particularly low overall registration rates? What about the lowest rates for male and female voters? What types of districts are those? What might explain these trends?
- What districts stand out to you as having particularly high overall registration rates? What about the highest rates for male and female voters? What types of districts are those? What might explain these trends?
Evaluating Registration Rates Across District Type
Congratulations on making it to the final portion of Module 7! You can put your INDEX MATCH skills aside for a moment as we move onto another type of analysis using the SUMIF function. We’ll use the Data_Summary tab of your voter registration file for the remainder of this exercise. Feel free to close out your census data file.
If you completed Modules 5 and/or 6, you’ll remember that we used SUMIF and percentages to summarize and analyze voter registration data according to the different types of districts in Opendya. We’ll do a similar type of analysis in this final portion of Module 7 to assess differences in registration rates between Opendya’s urban districts, rural districts, and the capital district.
Using SUMIF to add up data in a specific category
As a reminder, the SUMIF function is used to add up values in a specific range of cells that meet a criteria you’re looking for. In Module 7, we’ll use SUMIF twice to 1) add up the voting age population from urban districts, rural districts, and the capital district, respectively; and 2) sum the number of registered voters from the three district types.
Here’s how the formula is structured: SUMIF(range, criteria, [sum_range])
- **Range:**Range specifies the area of cells that you want evaluated by your specific criteria. For our purposes, we are summing data based on the type of district. Since the “type of district” is our criteria, what column in your datasheet do you think we need to use for our range? What column do we look at for information on the type of district? (Answer = Column C, Type)
- Criteria: Your criteria will indicate whether or not a number should be summed. Criteria can come in the form of a number, expression, a cell reference, text, or a function that defines which cells will be added. For this exercise, you’ll be selecting from three different criteria [urban, rural, and capital district] and asking Excel to add census and voter registration numbers from districts that fall into one of those specific categories.
- Sum_range: This tells Excel what cells to add, if you want to sum cells other than those specified in the range argument. For this exercise, your sum_range will be either the voting age population data or the registered voters data.
Let’s put this into practice in our Data_Summary tab!
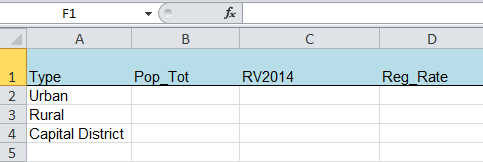
SUMIF Pop_Tot
In column B, Pop_Tot, of your Data_Summary tab, let’s use SUMIF to add up the voting age population totals for each of Opendya’s three district types. This will tell us how many eligible voters live in urban districts vs. rural districts vs. the capital district.
We’ll start by summing the number of registered voters for urban districts, then move on to rural districts and the capital.
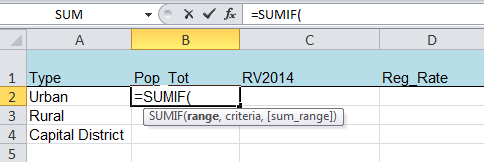
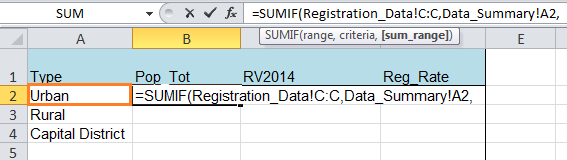
1. In cell B2 type =SUMIF(. Notice that Excel automatically provides you with the information needed to complete the rest of the formula.
2. Now we need to specify the range for Excel to pull your data from. Since we’re looking for a specific district type, your range will be column C, Type, from the Registration_Data tab. To reference your range, leave your formula open and click on the Registration_Data tab in the bottom left-hand corner of your file. (Do not click Enter before you switch to the main data tab or else your formula will not continue to populate!)
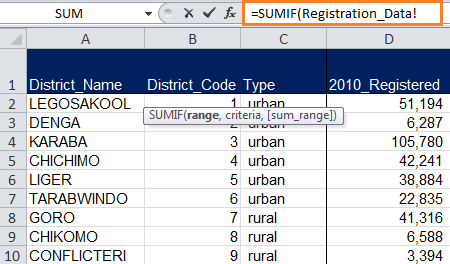
Notice when you come back to Registration_Data that your formula bar continues to update based on where you click. Excel sees that you’re trying to establish a connection between your SUMIF calculation on your Data_Summary tab and information on your Registration_Data tab.
To finish selecting the range, select all of column C by clicking the the top of the column. Again notice that Excel autopopulates your formula as you click.
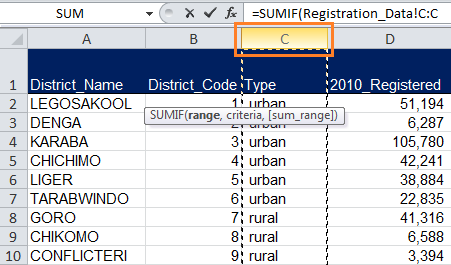
You’ve now selected your range! Type in a comma , and we’ll move on.
3. SUMIF now requires that you select your specific criteria. Your criteria tells Excel what to sum and what to omit. Without hitting Enter, click back to the Data_Summary tab and click on cell A2 “Urban.” You just told Excel that you only want it to grab and sum data from urban districts in Opendya.
Type another comma ,.
4. Last, we need to tell Excel what data to add up based on our criteria (urban). In this instance, we’re adding up the total voting age population. That information is now stored in column L, Match_VAP_Tot, of the Registration_Data tab (following our INDEX MATCH exercise). Leaving your formula open, click back to the Registration_Data tab and select all of column L.
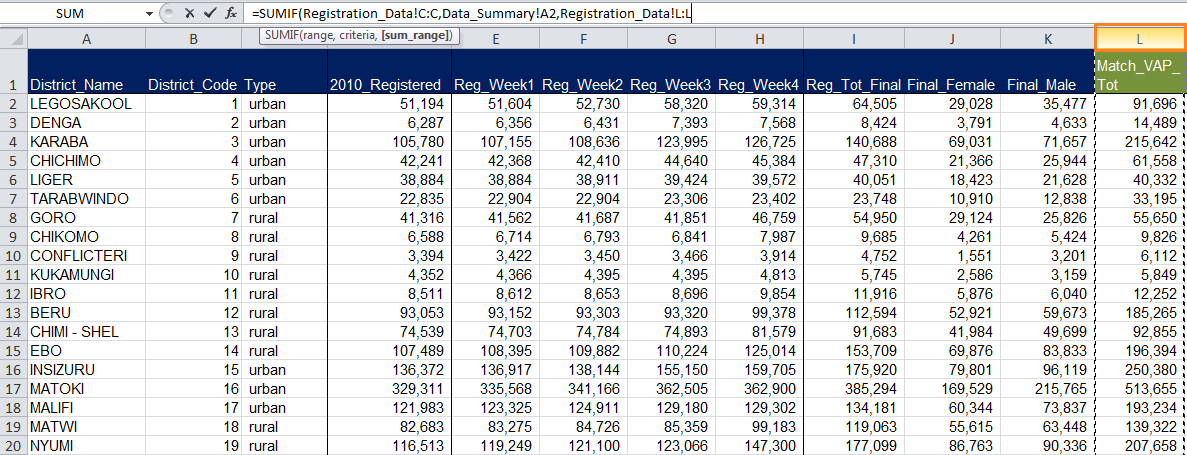
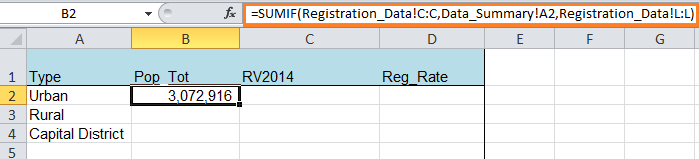
5. Close your parentheses )and hit Enter! What is the total voting age population in Opendya’s urban districts?
We hope you calculated 3,072,916 citizens!
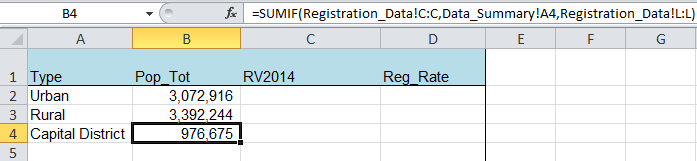
6. Now, have Excel replicate your Pop_Tot calculation for rural districts and the capital district. As a reminder, you can double click the box in the bottom right corner of cell B2 or you can manually re-enter the formulas using “rural” and “capital district” as your new criteria. Here’s what you should have.
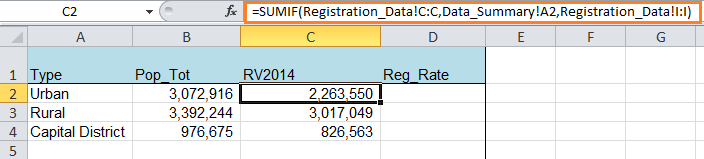
SUMIF RV2014
One SUMIF down, one more to go! You’re going to use SUMIF again to calculate the final number of registered voters in 2014 in Opendya’s three types of districts. (Note: If you completed Module 5 and are using your original data file, you should already have completed this calculation in the column labeled “RV2014.” If you’d prefer, you can jump ahead to the final calculation of Module 7, Reg_Rate. If you did not do Module 5, or would just like to give this calculation a second try, stick with this section of the exercise.)
Think about the process you just used to sum voting age populations across district type. How might that formula equate or differ from your upcoming task of summing of registered voter totals?
1. Repeat steps 1 and 2 from above which tell you how to select the range and criteria for your SUMIF function. You’re range is still column C, Type, of your Registration_Data tab, and you’re still selecting a specific district type as your criteria, likely beginning with urban districts.
2. Now, go to the Registration_Data tab and select all of column I, Reg_Tot_Final, which houses the final 2014 voter registration totals for each district.
Here’s what your final calculations should look like:
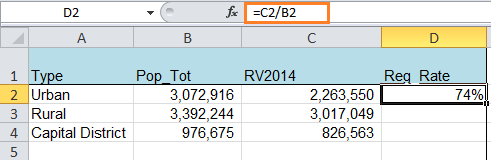
Calculating Reg_Rate
You’ve made it through some tough functions this module, and you’re almost at the finish line! We have one more calculation for you to complete, which should shed light on registration trends across Opendya.
In column D, Reg_Rate, of your Data_Summary tab, calculate voter registration rates across Opendya’s three district types. The logic behind this calculation is the same as the district-by-district registration rates you calculated in columns O-Q of your Registration_Data tab (Calculated_Reg_Rate, Calculated_Female_Reg_Rate, and Calculated_Male_Reg_Rate).

1. In cell D2, corresponding to urban districts, type an equals sign =. Then click on cell C2, which provides the number of registered voters in Opendya’s urban districts.
2. Type a forward slash / which indicates that you’d like to divide the contents of cell C2 by something else. Then click on cell B2, the voting age population in Opendya’s urban districts.
3. Hit Enter. What is the registration rate for urban voters in Opendya?
4. Now replicate this calculation for rural districts and the capital district.
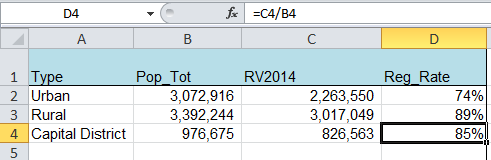
What do you see?
Masterfully done!
Now that you’ve calculated registration rates across Opendya’s three district types, what trends do you notice? What district types have the highest and lowest registration rates? Thinking back to the political context you were given at the beginning of this module, what might explain those trends?