6. Evaluating Temporal Trends in Voter Registration
Module 6 will solidify skills you began to master in Module 5 to allow you to do a more advanced analysis of voter registration data. We hope that by the end you will be able to:
- Master your understanding of SUMIF functions,
- integrate SUMIF functions into basic Excel operations, and
- consider political ramifications of your data.,
Why Voter Registration Data?
As we mention in the Election Data Guide, a fair voter registration process fosters political equality and actively encourages the inclusion of eligible voters. When the voter registration process is fair and transparent, it can increase the legitimacy of an election. Alternatively, when the voter registration process is poorly executed or does not provide for equal participation, it can cast doubts on the legitimacy of an entire election.
Civil society organizations often use voter registration statistics to determine whether the overall process was fair and inclusive. Modules 5 and 6 will improve your ability to undertake this important kind of analysis.
Welcome back to Opendya!
We’re heading back to Opendya! As you’ll recall, you were able to get ahold of a set of voter registration data compiled by the Election Commission. The file contains data on a five week voter registration update exercise organized ahead of the 2014 election.
While not required, we suggest that you complete Module 5 first, so that you are familiar with the data set and political background of Opendya. If you haven’t completed Module 5, here’s some important political background you should be familiar with:
- Opendya had national elections in 2010 and 2014.
- The capital of Opendya is in the Opa City district (District code: 47), which contains a mixture of urban and rural areas.
- Since the 2010 elections, violent conflict broke out in two districts: Conflicteri (District code: 9) and Disputana (District Code: 23).
- Ahead of the 2014 polls, the Election Commission of Opendya conducted a five-week voter registration update exercise, adding new voters to the rolls.
To complete this exercise, you can continue to use the dataset you downloaded in Module 5, or you can re-download the file here.
Reviewing the Voter Registration Data
Let’s reacquaint ourselves with Opendya’s voter registration data by reviewing the contents of our file. If you’ve completed Module 5 and are already familiar with this data, you can skip right through this section and jump straight to your analysis.
We’ll first review the Registration_Data tab, which contains a variety of data on the registration process in Opendya. Then we’ll take a look at the Data_Summary tab, where we’ll do our analysis.
District_Name
The far left column of the Registration_Data tab contains the names of all districts in Opendya. Notice that this is the only geographic level provided in the dataset. At this stage, we have no further indication as to whether these districts are nearby one another or if they fall under the same geographic units at a higher level. 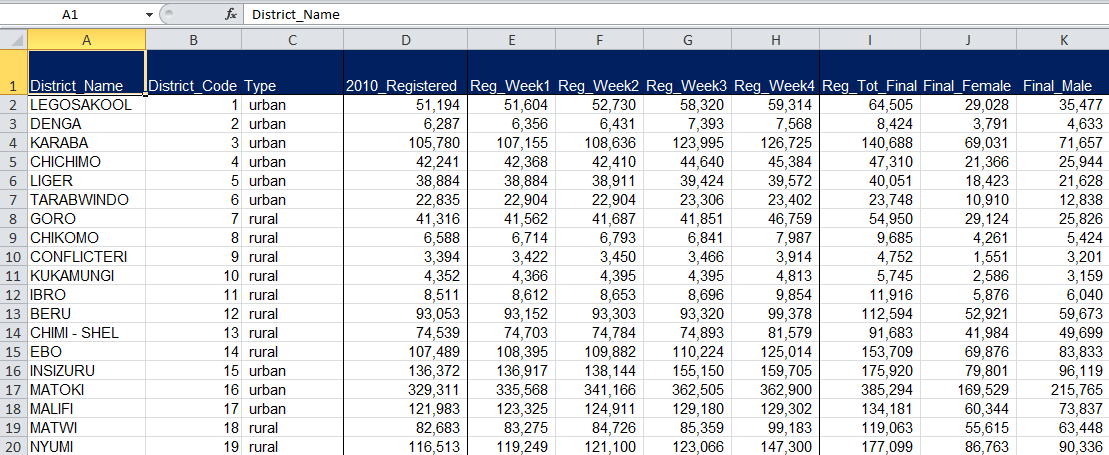
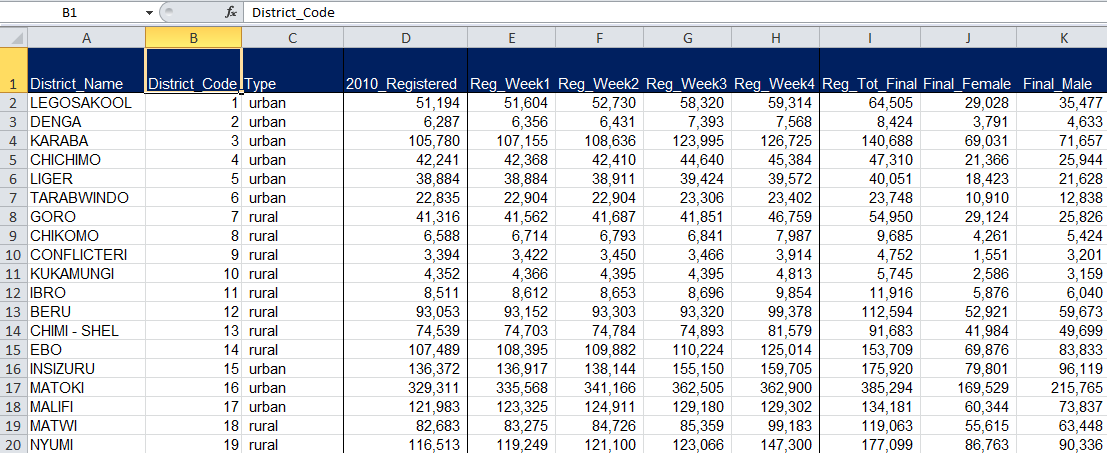
District_Code
The Election Commission of Opendya also assigns each district a unique code, or identifier. Take a quick second to scroll through the file and notice the pattern of how the districts are numbered. (This is an easy one!)
As we mentioned in Module 2: Reviewing a Polling Station List, unique identifiers are extremely helpful when dealing with datasets. They help us catch duplicate entries and/or properly distinguish between units with similar names.
Type
The Type column indicates the characteristics of Opendya’s districts. Check through the data to review what descriptors are used to indicate the type of district. What different types do you see?
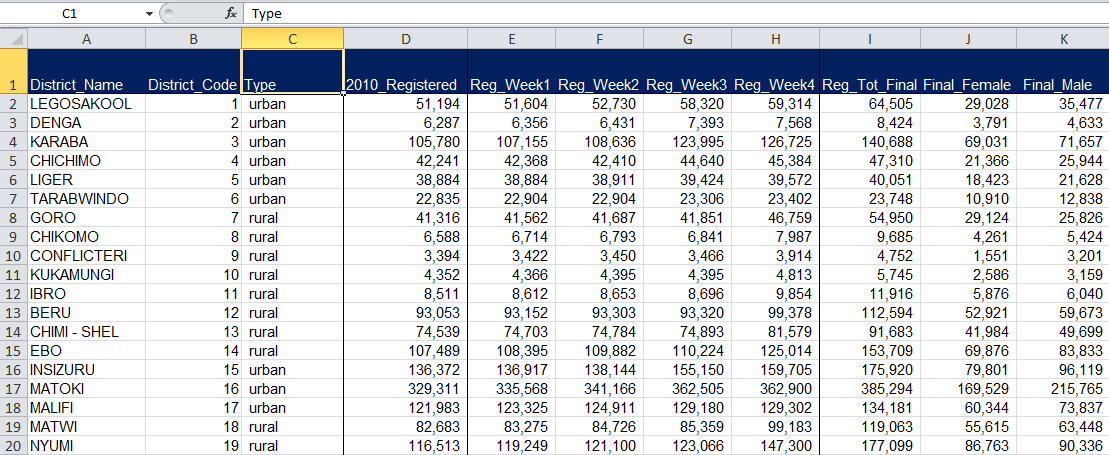
There are three types of districts in this dataset: urban, rural, and capital district.
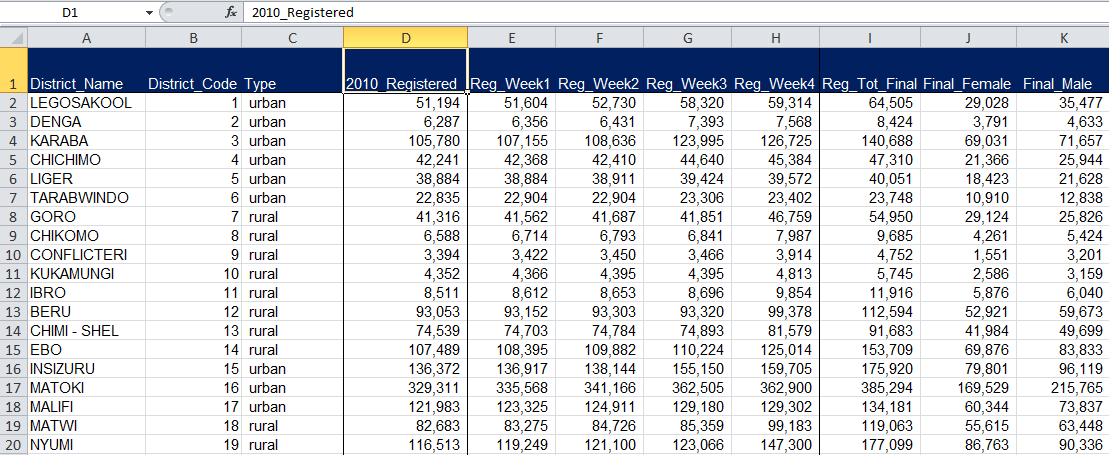
2010_Registered
We mentioned previously that Opendya had national elections in 2010. This data set contains the final number of registered voters when that election took place. We can use the 2010_Registered column to compare registration figures between election cycles.
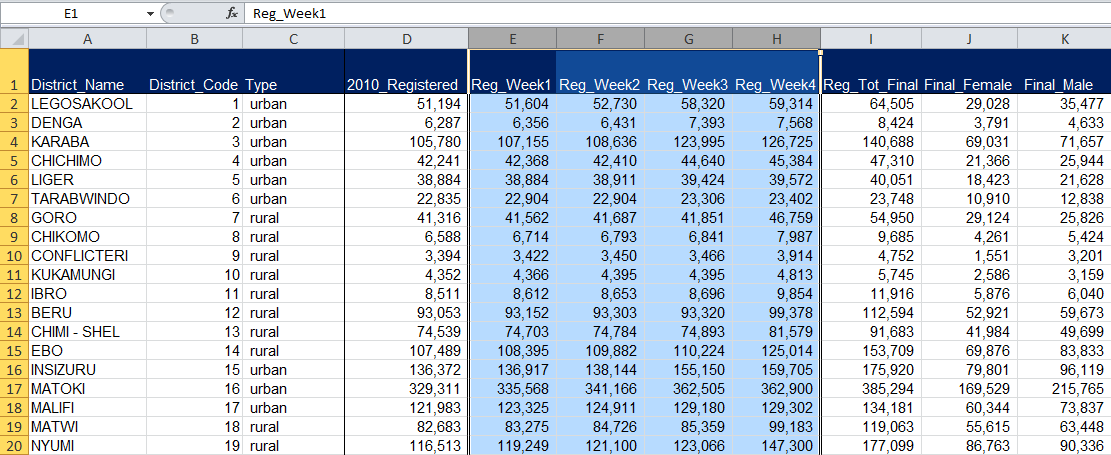
Reg_Week1, Reg_Week2, Reg_Week3, and Reg_Week4
We mentioned that Opendya’s Electoral Commission undertook a five-week voter registration update in 2014. The following four columns – Reg_Week1, Reg_Week2, Reg_Week3, and Reg_Week4 – provide us with the total number of registered voters at the end of four of the five weeks of the 2014 update exercise. The difference between each week gives us the number of new voters who registered during the exercise.
These numbers can tell us how the the Electoral Commission performed over time and can highlight any spikes or lulls in registration in specific districts and/or at specific moments. You’ll work with these columns to complete Module 6.
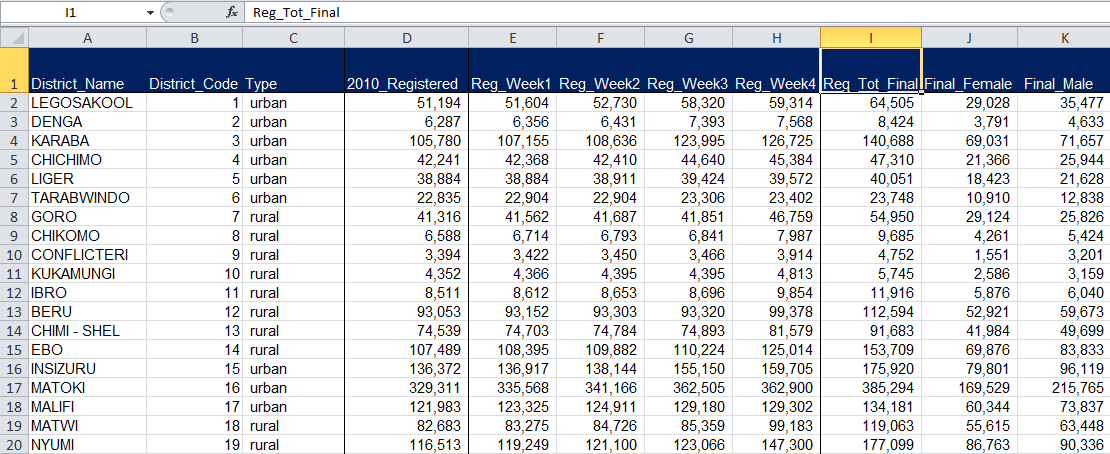
Reg_Tot_Final
The Reg_Tot_Final column provides the final total of registered voters per district following the entire five-week registration exercise in 2014. Notice that the difference between figures in Reg_Week4 and Reg_Tot_Final accounts for voters who registered during the fifth and final week of the update period.
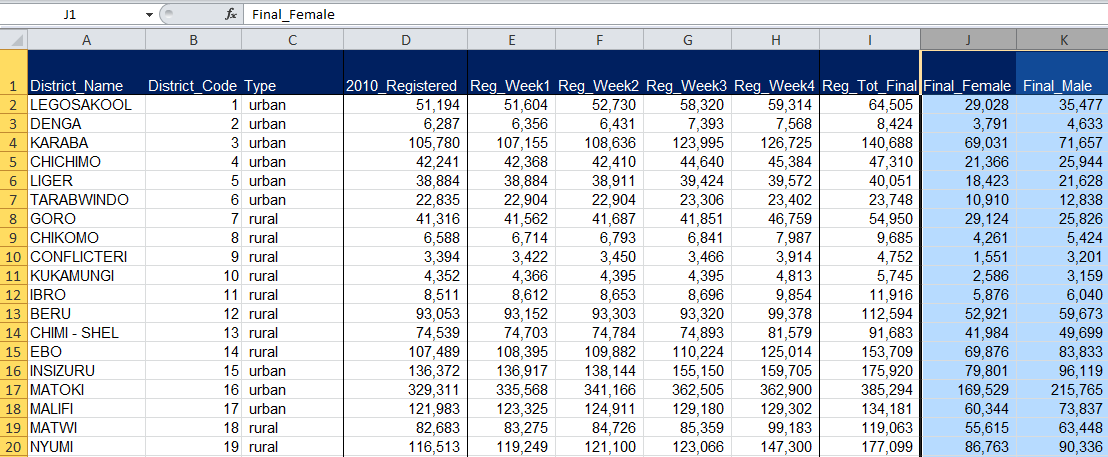
Final_Female, Final_Male
Here we can see how many women and men, in total, are registered to vote in each district for the 2014 election. Note that we only have the final 2014 figures of female and male voters, rather than weekly figures.
Now that we know our data, let’s move on to analysis.
Reviewing the Data_Summary Tab
In Module 6, we’ll use the Data_Summary tab in your Excel file to pull a summary of calculations based on data from the Registration_Data tab. It looks like this. We’ll specifically use columns A and F through O (columns B through E were used in Module 5.)
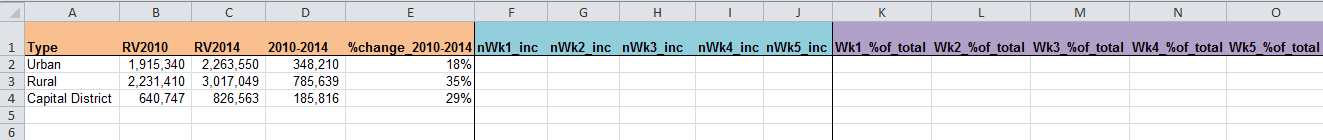
Note: Calculations in columns B through E were completed in Module 5.
Evaluating Weekly Registration Trends Across District Type
In Module 6, you’ll put all of your analysis skills together to assess trends in voter registration over time in each of Opendya’s three district types. This will give us a sense of where and when voters registered during the 2014 update period.
We’ll do the following types of analysis:
- For each district type (urban, rural, and the capital district), calculate the number of new voters added during each week of the 2014 voter registration exercise.
- Calculate what percentage of new voters were added during each week of the voter registration update, across all three district types.
- Analyze patterns in registration over time and consider their political ramifications.
Reminder: Using SUMIF to add up data in a specific category
In this module, we’ll continue to use the Excel function SUMIF quite a bit. As a reminder, the SUMIF function is used to add up values in a specific range of cells that meet a criteria you’re looking for. For our purposes, we’ll use SUMIF to add up registered voter figures that pertain specifically to urban districts, rural districts, and the capital district.
Here’s how the formula is structured: SUMIF(range, criteria, [sum_range])
- Range: Range specifies the area of cells that you want evaluated by your specific criteria. For our purposes, we are summing data based on the type of district. Since the “type of district” is our criteria, what column in your datasheet do you think we need to use for our range? What column do we look at for information on the type of district? (Answer = Column C, Type)
- Criteria: Your criteria will indicate whether or not a number should be summed. Criteria can come in the form of a number, expression, a cell reference, text, or a function that defines which cells will be added. For this exercise, you’ll be selecting from three different criteria [urban, rural, and capital district] and asking Excel to add voter registration numbers from districts that fall into one of those specific categories.
- Sum_range: This tells Excel what cells to add, if you want to sum cells other than those specified in the range argument.
A. Calculating the weekly increase in registration across district types
We’d like you to calculate the number of additional voters registered during each week of Opendya’s 2014 voter registration update according to district type. In other words, you need to calculate the difference in the number of registered voters week-to-week for urban districts, rural districts, or the capital district.
We hope you didn’t already forget your SUMIF function skills from Module 5! You’re sure going to need them here.
Number of new voters added after week 1 of registration (“nW1_incr”)
The “nW1_icnr” column in your Data_Summary tab is where you’ll calculate the number of new voters added to the registry after Week 1 of the 2014 registration update. Again, you’ll need to uniquely calculate this figure for all three district types. Before we walk you through, think to yourself how you might go about doing this calculation? What functions and columns will you need? (Note: You’ll need to pull data from the Registration_Data tab.)
To calculate the number of new voters added in Week 1 of registration, you’ll need to use column F “Reg_Week1” from your Registration_Data tab. Remember that that column contains the total of registered voters in each district after the first week of the 2010 registration update; it does not tell you the number of voters who registered during that specific week. Second, you’ll need to use your column A “RV2010” from your Data_Summary tab. You should have completed calculations for column A in Module 5, which you’ll need to draw from now. (If you haven’t yet completed Module 5, click here now so that you can complete this analysis and proceed to the rest of Module 6.)
Here’s the logic you’ll need to use to make this calculation for urban districts. The same basic structure will apply for rural districts and the capital.
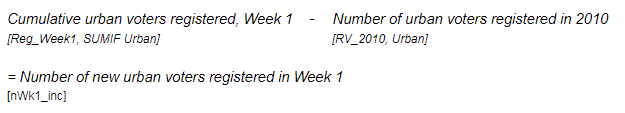
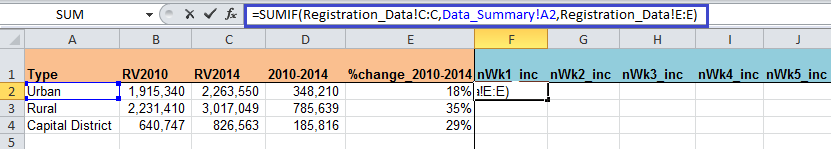
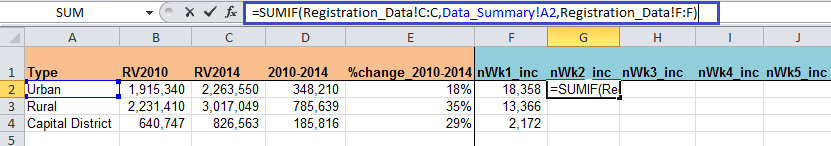
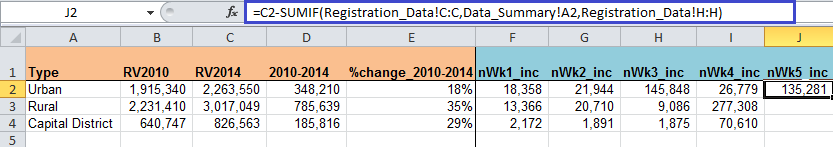
1. Using your SUMIF skills, use cell F2 in the Data_Summary tab to calculate the cumulative urban voters registered after week 1. Click here if you need some help.
Here’s how the SUMIF formula is structured: SUMIF(range, criteria, [sum_range]). Here’s how you can use SUMIF to add up the cumulative number of urban registered voters after week 1 of registration.
- Range: Range specifies the area of cells that you want evaluated by your specific criteria. For our purposes, we are summing data based on the type of district. Since type of district is our criteria, we need to use column C, “Type” from the Registration_Data tab.
- Criteria: Your criteria will indicate whether or not a number should be summed. Criteria can come in the form of a number, expression, a cell reference, text, or a function that defines which cells will be added. For this exercise, you’ll be selecting from three different criteria [urban, rural, and capital district] and asking Excel to add numbers that fall into one of those specific categories. Here, you can click on either cell A2, A3 or A4 in your Data_Summary tab to specify your criteria.
- Sum_range: This tells Excel what cells to add, if you want to sum cells other than those specified in the range argument. Here, you’re asking Excel to sum the number of registered voters after Week 1 of the update, only in urban districts (column E = Reg_Week1).
After you’ve completed your SUMIF function, insert a closed parenthesis [)] but don’t hit enter! We’re going to add a subtraction function in the same cell. Yes, you can use multiple Excel formulas at once!
2. At the end of your formula in cell F2, type a minus sign [-] and click on cell B2, which gives us the number of urban registered voters as of 2010.
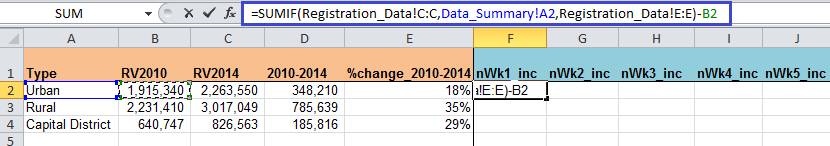
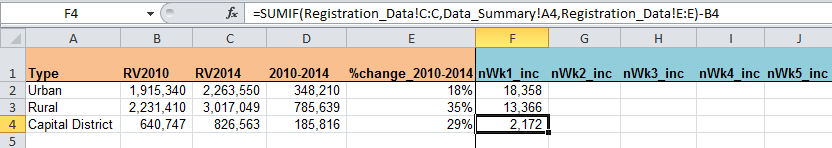
3. Click Enter and check out your answer! What did you get? If you calculated that there were 18,358 urban voters added after week one of registration, you are correct!
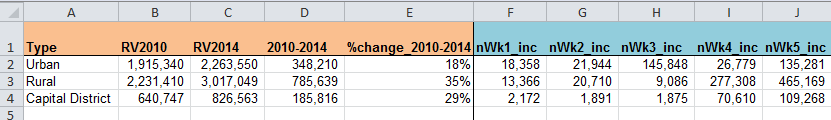
4. As we’ve done before, ask Excel to replicate your formula for both rural and the capital areas. It’s always good practice to click through the calculations that Excel auto-generates to make sure the program did what you wanted. In this case, as pictured below, you’ll notice that Excel automatically altered your “criteria” to a different type of district, moving down your options in column A. In line with your rows, Excel also knew to subtract cells different cells in column B “RV2014,” which correspond to the 2010 registered voter populations in rural districts and the capital district.
Number of new voters added after week 2 of registration (“nW2_incr”)
Your formula will get a little more complicated as we calculate the difference between Week 1 and Week 2 of Opendya’s registration process. Here, we will need to use two SUMIF statements in the same cell. It’s a doozy, but you’ll be just fine.
Here’s the logic you’ll use for this calculation. Review it carefully to make sure you understand.
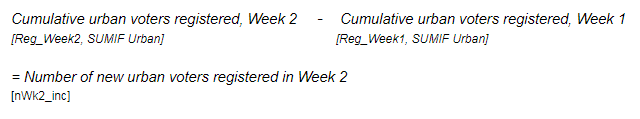
1. Let’s start working on the Week 2 calculation in cell G2. First, using SUMIF, calculate the sum of cumulative urban voters following Week 2 of registration. See below for an image of what this formula looks like.
2. Next we’re going to ask Excel to subtract something by typing in a minus sign [-]. Don’t hit Enter yet!
3. You’re now going to type in a second SUMIF formula that asks Excel to sum up the cumulative number of urban voters following Week 1 of registration. (Note: That this is the exact same SUMIF formula you should have typed to complete the “nW1_incr” calculation shortly ago, however do not need to subtract “RV2010.”) See below for an image of the full formula.
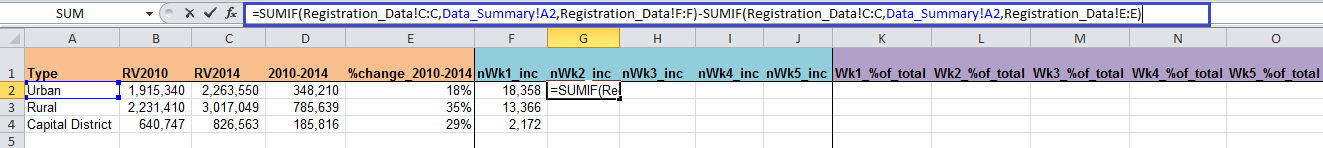
4. Hit enter and see what you’ve got! If you calculated that 21,944 additional urban voters were registered during Week 2, you are correct!
If this is not your answer, investigate your formula to see if you accidentally clicked the wrong spot at some point. Remember Excel populates your formulas based on where you click!
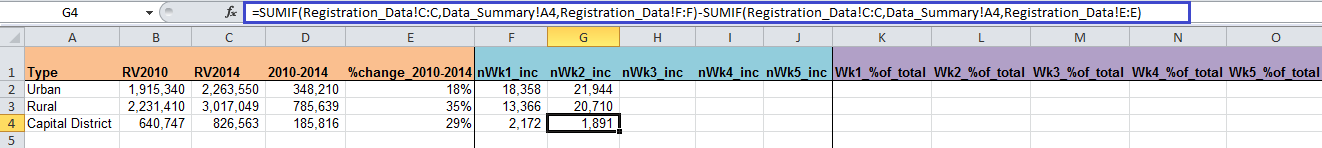
5. Now replicate your Week 2 calculation for rural districts and the capital. Here’s what you should have.
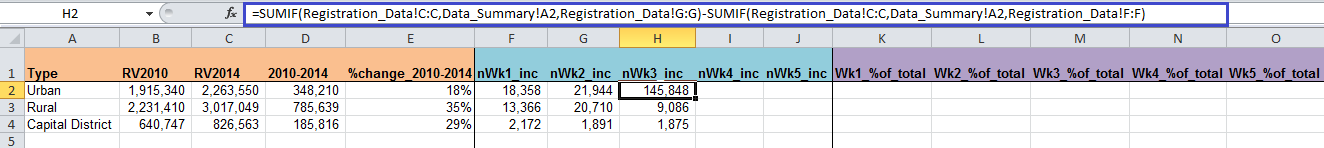
Number of new voters added after week 3 of registration (nW3_incr)
Your Week 3 calculation shouldn’t be as scary. It’s the exact same logic and formulas that you used above, but this time you’re subtracting the cumulative Week 3 registered voters total from the cumulative Week 2 registered voters total.
Try this on your own! Once you’re done, feel free to click here for the formula and answers.
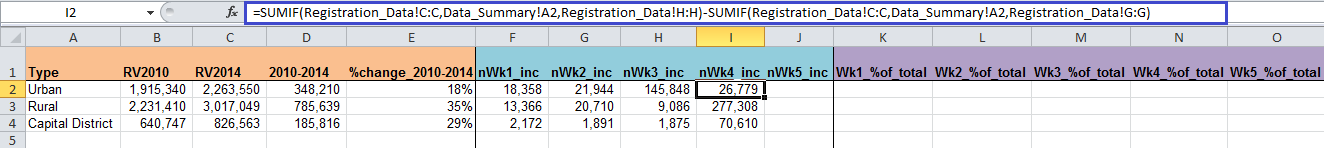
Number of new voters added after week 4 of registration (“nW4_incr”)
We hope you can handle Week 4’s calculations on your own. Same old logic and formulas!
Once you’re done, click here for the formulas and final calculations.
Number of new voters added after final week of registration (“nWf_incr”)
You’re almost at the finish line! This last formula will be a bit simpler, but you’ll need to think through the logic carefully. Here, you’re calculating how much voter registration increased during the fifth and final week of registration.
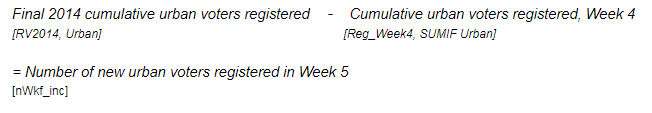
Remember that in Part A of this module you calculated the cumulative number of 2014 voters in each of Opendya’s district types (column C “RV2014”). That will save you some effort here, so you won’t need to do another SUMIF function for that component.
1. In cell J2, type in your trusty equals sign [=] and click on cell C2, which gives the final total of urban voters for the 2014 election.
2. Add a minus sign [-]. Here’s where you should be:
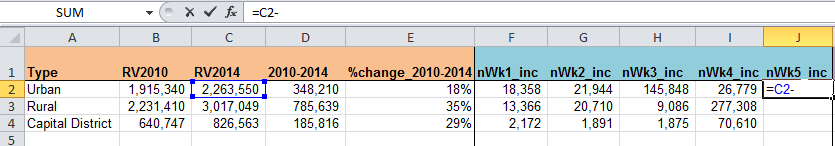
3. Now it’s time for your last SUMIF formula. You’ll use this to calculate the cumulative urban voters from Week 4 of the registration process. Do this SUMIF formula on you own.
How many new urban voters were registered during Week 5? Click here if you would like to view an image of the formula.
4. Now replicate your formula for the two remaining district types. Here’s what you should have!
Congratulations! You have mastered the SUMIF formula and have made very useful calculations about Opendya’s 2014 voter registration exercise.
Proceed to the last part of this module to give the registration figures you’ve calculated more meaning through percentages and political analysis.
B. Calculating the weekly registration increase as a percentage of the total increase
You’ve successfully calculated how much voter registration increased in Opendya week by week in different types of districts. In the context of the overall registration update, it would be interesting to know which weeks yielded the largest respective registration boosts in different types of districts. What trends over time would you expect to see?
To do this calculation, you’ll need to work with columns H-L in your Data_Summary tab, as well as column F “2010-2014” which indicates the total difference increase in registered voters from the 2010 to 2014 elections per district type.
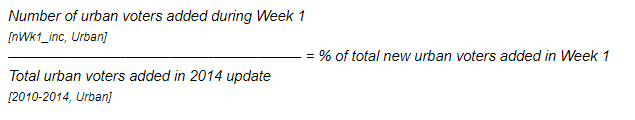
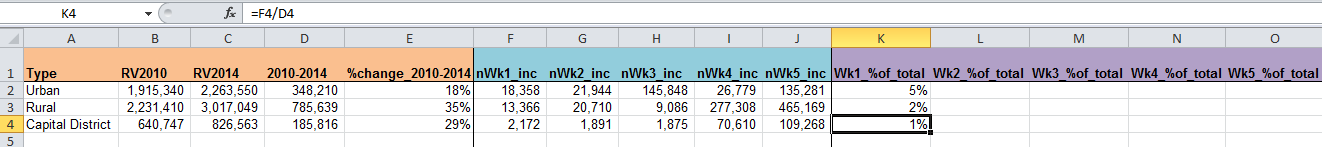
Percent of new registered voters who enrolled during week 1 (“Wk1_%of_total”)
Let’s see what percent of Opendya’s new registered voters enrolled during Week 1 of the update period, across district types. What data columns do you think we need to use to complete this calculation? Keep in mind that we are looking at each week’s increase in comparison to the total increase during the update exercise.
Using only the Data_Summary tab, we’ll use column H “nWk1_inc” and column F “2010-2014.” See below for the calculation structure.
1. In cell K1, ask Excel to divide the number of urban voters added in Week 1 (cell K2) by the total number of urban voters added between 2010-2014 (cell D2). What percent of urban voters were added during Week 1?
Check your response below.
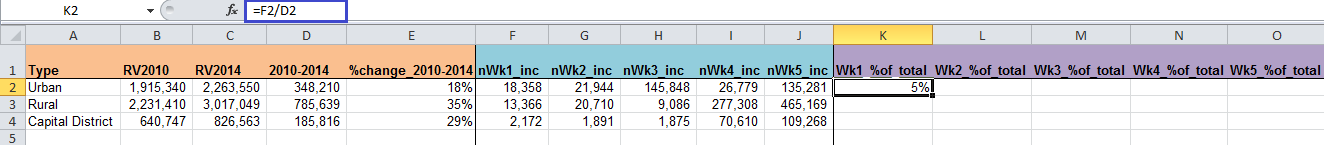
2. Now repeat your calculation for your remaining two district types. You can check your responses below.
Percent of new registered voters who respectively enrolled during weeks 2, 3, 4 and 5 (“Wk2_%of_total”, “Wk3_%of_total”, “Wk4_%of_total”, and “Wkf_%of_total”)
Use the exact same Excel formulas and mathematical logic to complete the percentage calculations for Weeks 2 through 5 of the 2014 registration update.
Remember for each district type, you are dividing the number of new voters enrolled during a specific week (columns G through J), by the total number of new voters added between 2010 and 2014 (column D).
Here’s what your final set of calculations should look like!
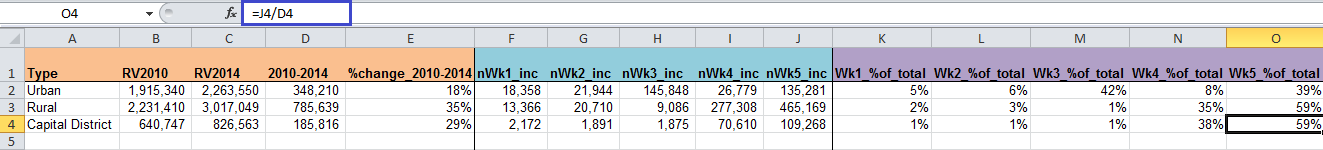
What do you see?
Look at how the 2014 voter registration update in Opendya proceeded over time and across different types of districts.
- At what points and in what types of districts were the most voters registered during the 2014 update? When and where were the least voters registered during the 2014 update?
- What political trends might these patterns indicate?
- As an election observer, what additional information might you like to gather to support your analysis of these trends? How would you collect that information?